Technical Analysis of SPIB 2024-05-10
Overview:
In analyzing the technical indicators for SPIB over the last 5 days, we will delve into the trend, momentum, volatility, and volume indicators to provide a comprehensive outlook on the possible stock price movement in the coming days. By examining these key indicators, we aim to offer valuable insights and predictions for potential investors and traders.
Trend Analysis:
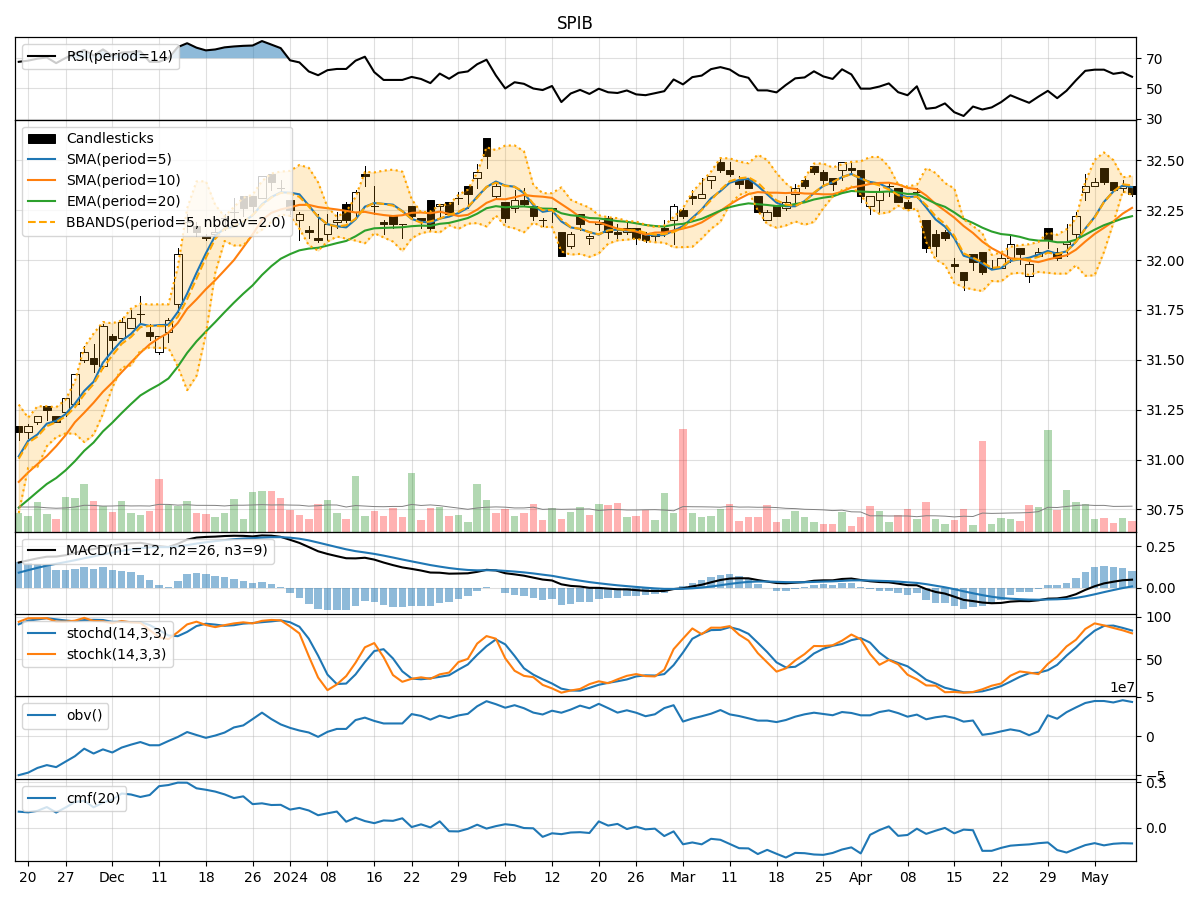
- Moving Averages (MA): The 5-day Moving Average (MA) has been relatively stable around the current price levels, indicating a short-term equilibrium in the stock's price movement.
- MACD: The Moving Average Convergence Divergence (MACD) has shown a slight positive trend, with the MACD line crossing above the signal line, suggesting a potential bullish momentum.
- EMA: The Exponential Moving Average (EMA) has been gradually increasing, reflecting a positive price trend over the past few days.
Momentum Analysis:
- RSI: The Relative Strength Index (RSI) has been hovering around the neutral zone, indicating a balanced momentum in the stock.
- Stochastic Oscillator: Both %K and %D of the Stochastic Oscillator have been declining, signaling a potential reversal in the stock's momentum.
- Williams %R: The Williams %R indicator has been in the oversold territory, suggesting a possible upcoming bullish reversal.
Volatility Analysis:
- Bollinger Bands: The Bollinger Bands have been narrowing, indicating decreasing volatility in the stock price.
- Bollinger %B: The %B indicator has been relatively low, suggesting a potential buying opportunity as the stock price may be oversold.
Volume Analysis:
- On-Balance Volume (OBV): The OBV indicator has shown mixed signals, with no clear trend in volume accumulation or distribution.
- Chaikin Money Flow (CMF): The CMF has been negative, indicating a slight outflow of money from the stock.
Conclusion:
Based on the analysis of the technical indicators, the stock price of SPIB is likely to experience a short-term bullish movement in the coming days. The positive trends in the MACD and EMA, coupled with the potential reversal signals in the momentum indicators, suggest a favorable outlook for the stock. Additionally, the decreasing volatility and the oversold condition indicated by Williams %R further support the bullish view.
Key Conclusion: The next few days are likely to see an upward movement in the stock price of SPIB. Investors may consider taking advantage of the potential buying opportunity presented by the current technical indicators.