Technical Analysis of SPIP 2024-05-10
Overview:
In analyzing the technical indicators for SPIP over the last 5 days, we will delve into the trend, momentum, volatility, and volume indicators to provide a comprehensive outlook on the possible stock price movement in the coming days. By examining these key indicators, we aim to offer valuable insights and predictions for potential investors.
Trend Indicators:
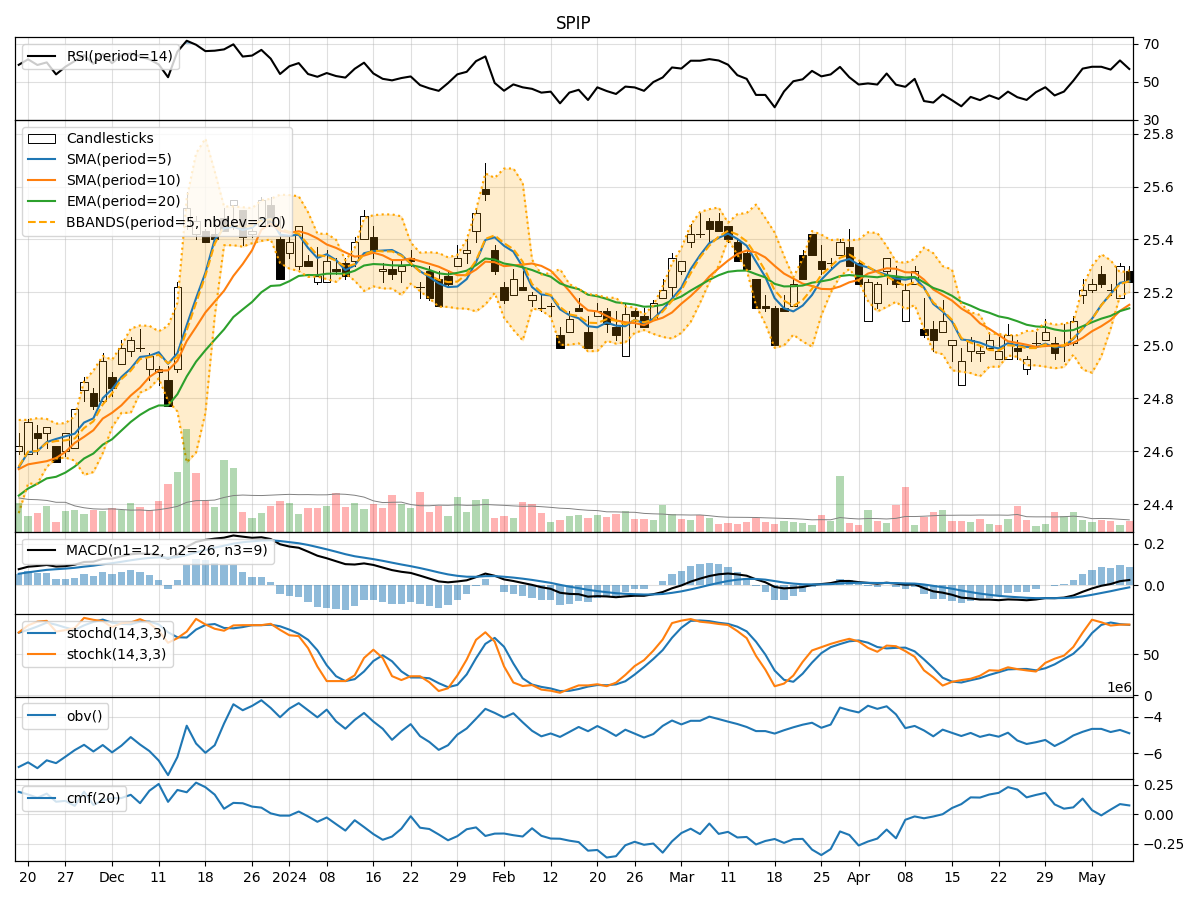
- Moving Averages (MA): The 5-day Moving Average (MA) has been consistently above the Simple Moving Average (SMA) and Exponential Moving Average (EMA), indicating a bullish trend.
- MACD: The MACD line has been consistently above the signal line, suggesting a positive momentum in the stock price.
Momentum Indicators:
- RSI: The Relative Strength Index (RSI) has been fluctuating around the 50 level, indicating a neutral momentum in the stock.
- Stochastic Oscillator: Both %K and %D lines of the Stochastic Oscillator have been hovering around the overbought territory, suggesting a potential reversal in the stock price.
Volatility Indicators:
- Bollinger Bands (BB): The stock price has been trading within the Bollinger Bands, with the bands narrowing, indicating a period of low volatility.
Volume Indicators:
- On-Balance Volume (OBV): The OBV has shown mixed signals, with fluctuations in volume accumulation, reflecting uncertainty in market participation.
- Chaikin Money Flow (CMF): The CMF has been positive, indicating buying pressure in the stock.
Key Observations:
- The trend indicators suggest a bullish sentiment in the stock price, supported by the moving averages and MACD.
- Momentum indicators show a neutral stance, with the RSI indicating a lack of strong momentum.
- Volatility indicators point towards a period of low volatility, potentially leading to a consolidation phase.
- Volume indicators reflect mixed signals, with OBV showing fluctuations and CMF indicating buying pressure.
Conclusion:
Based on the analysis of the technical indicators, the stock price of SPIP is likely to experience sideways movement in the coming days. The bullish trend indicated by moving averages and MACD may be offset by the neutral momentum and low volatility environment. Investors should exercise caution and closely monitor key support and resistance levels for potential trading opportunities.