Technical Analysis of SPLG 2024-05-10
Overview:
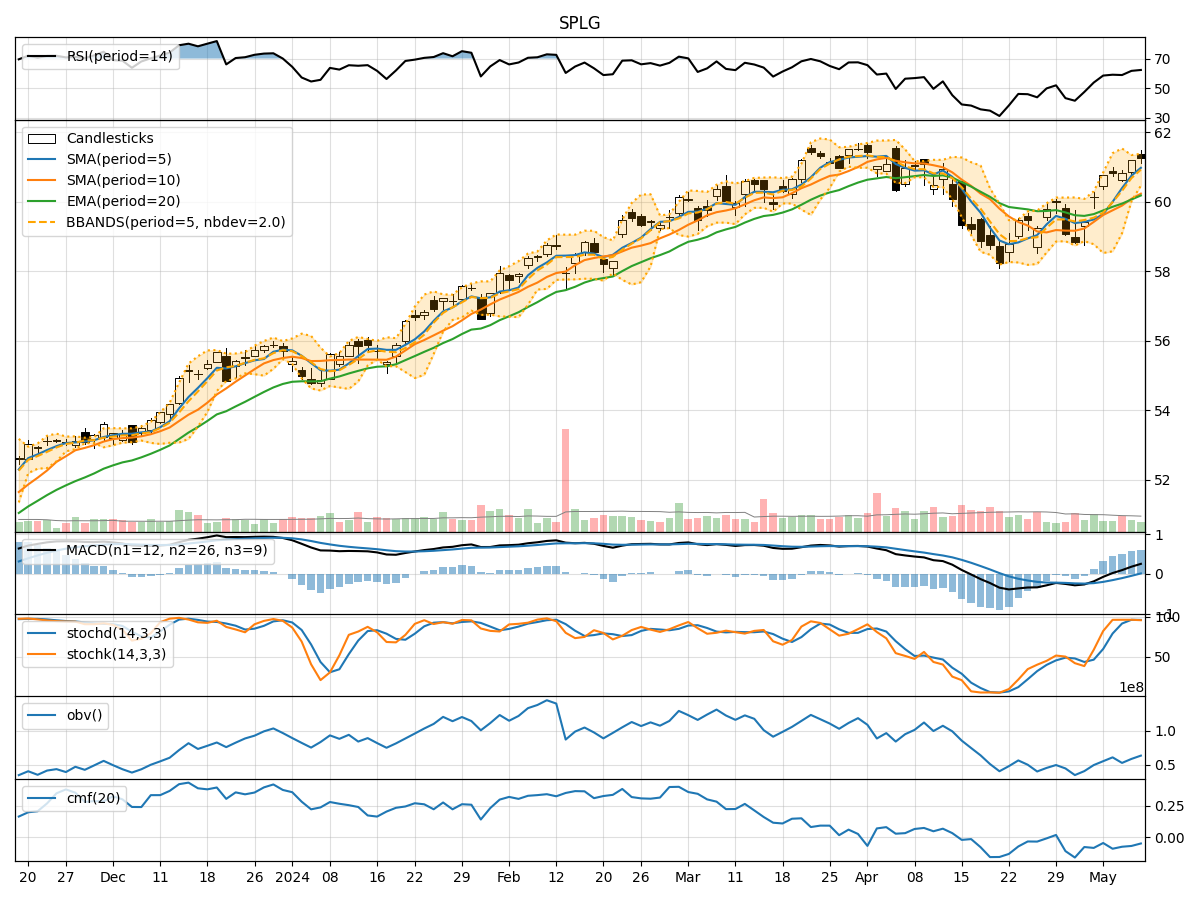
In analyzing the technical indicators for SPLG over the last 5 days, we will delve into the trend, momentum, volatility, and volume indicators to provide a comprehensive outlook on the possible stock price movement in the coming days. By examining these key indicators, we aim to offer valuable insights and predictions for informed decision-making.
Trend Analysis:
- Moving Averages (MA): The 5-day Moving Average (MA) has been consistently above the Simple Moving Average (SMA) and Exponential Moving Average (EMA), indicating a bullish trend.
- MACD: The MACD line has been consistently above the signal line, with the MACD Histogram showing an increasing positive trend, suggesting bullish momentum.
Momentum Analysis:
- RSI: The Relative Strength Index (RSI) has been in the overbought territory, indicating a strong bullish momentum.
- Stochastic Oscillator: Both %K and %D have been in the overbought zone, suggesting a potential reversal or consolidation.
Volatility Analysis:
- Bollinger Bands (BB): The stock price has been consistently trading above the middle Bollinger Band (BBM), indicating an upward trend. The narrowing of the bands suggests decreasing volatility.
- Bollinger %B (BBP): The %B has been above 0.5, indicating a bullish trend.
Volume Analysis:
- On-Balance Volume (OBV): The OBV has been showing a slight decrease, suggesting some distribution of shares.
- Chaikin Money Flow (CMF): The CMF has been negative, indicating selling pressure in the market.
Conclusion:
Based on the analysis of the technical indicators, the next few days' possible stock price movement for SPLG is likely to be upward. The bullish trend indicated by the moving averages and MACD, coupled with the strong momentum shown by RSI, suggests a continuation of the upward trajectory. However, caution is advised as the Stochastic Oscillator signals potential overbought conditions and a possible reversal or consolidation. The narrowing Bollinger Bands indicate decreasing volatility, which could lead to a period of consolidation before another leg up. Overall, the outlook remains bullish with a potential for a short-term consolidation phase.