Technical Analysis of SPMD 2024-05-10
Overview:
In analyzing the technical indicators for SPMD over the last 5 days, we will delve into the trend, momentum, volatility, and volume indicators to provide a comprehensive outlook on the possible stock price movement in the coming days. By examining these key aspects, we aim to offer valuable insights and predictions for informed decision-making.
Trend Indicators:
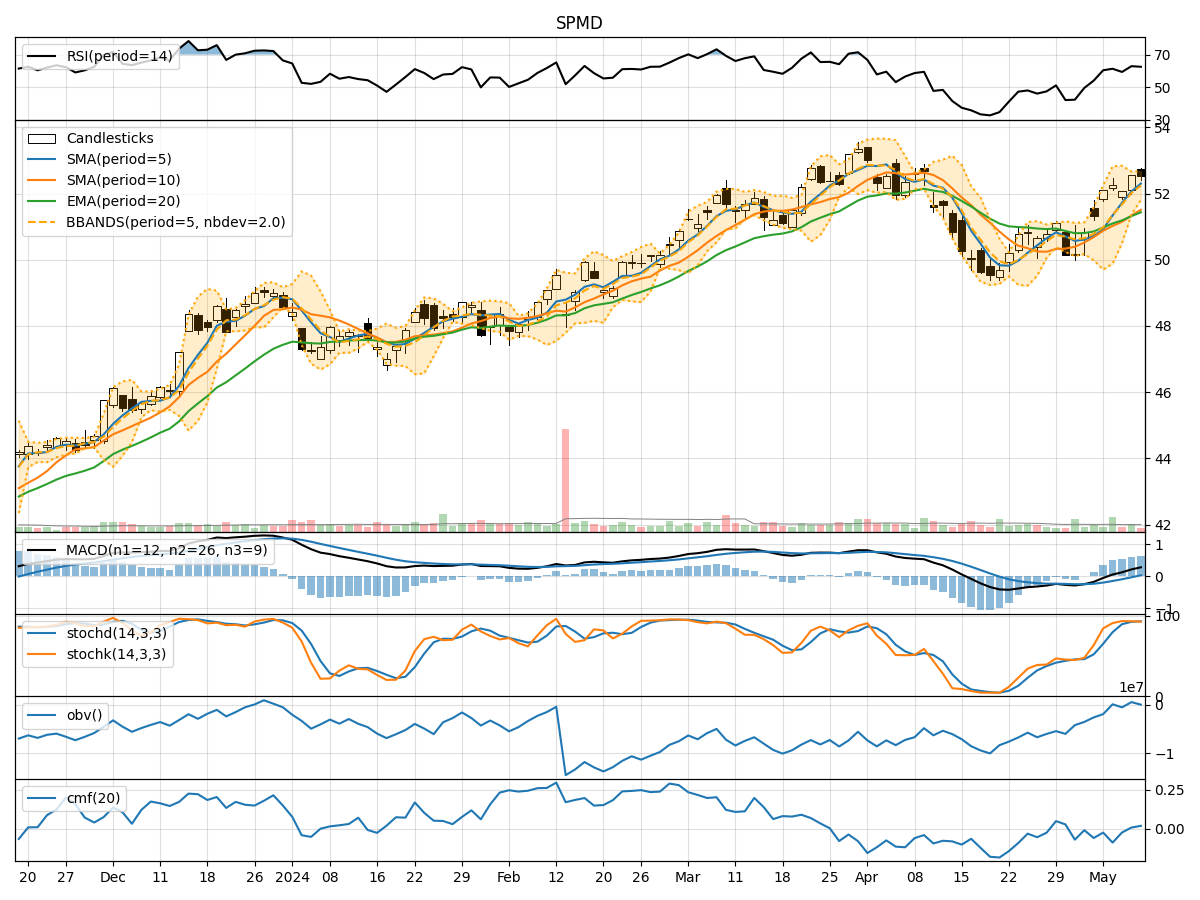
- Moving Averages (MA): The 5-day MA has been consistently above the 10-day SMA, indicating a short-term bullish trend. The EMA(20) has shown a gradual uptrend, reflecting positive momentum.
- MACD: The MACD line has been above the signal line for the past 5 days, suggesting bullish momentum.
- MACD Histogram: The MACD histogram has been increasing, indicating strengthening bullish momentum.
Momentum Indicators:
- RSI: The RSI has been in the overbought territory, suggesting a strong bullish momentum.
- Stochastic Oscillator: Both %K and %D have been in the overbought zone, indicating a potential reversal or consolidation.
- Williams %R: The Williams %R has been fluctuating in the oversold and overbought regions, signaling potential price reversals.
Volatility Indicators:
- Bollinger Bands: The price has been trading within the upper Bollinger Band, indicating an overbought condition.
- Bollinger Band Width: The BBW has been narrowing, suggesting a decrease in volatility.
- Bollinger Band %B: The %B indicator has been above 0.5, indicating an uptrend.
Volume Indicators:
- On-Balance Volume (OBV): The OBV has shown mixed signals, reflecting indecision in the market.
- Chaikin Money Flow (CMF): The CMF has been slightly negative, indicating some selling pressure.
Key Observations and Opinions:
- Trend: The trend indicators suggest a bullish bias in the short term, supported by moving averages and MACD.
- Momentum: Momentum indicators indicate a strong bullish momentum, but the overbought conditions suggest a potential reversal or consolidation.
- Volatility: Volatility indicators point towards a decrease in volatility, potentially leading to a period of consolidation.
- Volume: Volume indicators show mixed signals, reflecting uncertainty in market participation.
Conclusion:
Based on the analysis of the technical indicators, the next few days for SPMD could see a potential consolidation phase as the stock has been in overbought territory with decreasing volatility. Traders should watch for signs of a reversal in momentum indicators and monitor volume for confirmation of the price movement. Exercise caution and consider taking profits if holding long positions.