Technical Analysis of SPMV 2024-05-10
Overview:
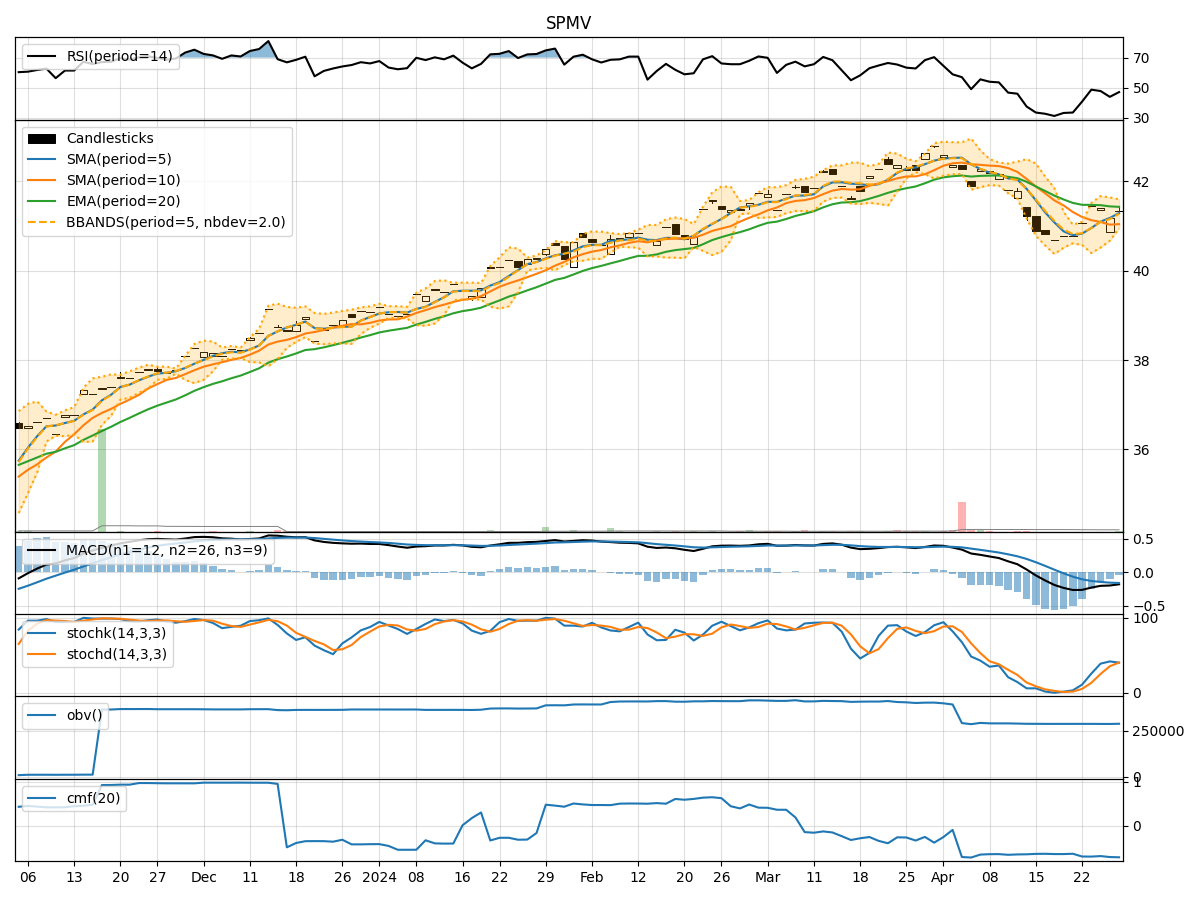
In the last 5 trading days, SPMV stock has shown a consistent uptrend in both price and volume. The moving averages have been steadily increasing, indicating a bullish trend. Momentum indicators like RSI and Stochastic oscillators are in overbought territory, suggesting a strong buying momentum. Volatility indicators show a narrowing Bollinger Band, indicating a potential breakout. However, the volume has been decreasing, which could be a cause for concern.
Trend Analysis:
- Moving Averages (MA): The 5-day MA has been consistently above the 10-day SMA, indicating a short-term bullish trend. The EMA(20) has been steadily rising, supporting the bullish sentiment.
- MACD: The MACD line has been above the signal line for the past 5 days, indicating a bullish trend. The MACD histogram has been increasing, showing strengthening bullish momentum.
Momentum Analysis:
- RSI: The RSI has been in overbought territory for the past 5 days, indicating a strong buying momentum. This could potentially lead to a continuation of the uptrend.
- Stochastic Oscillator: Both %K and %D have been at 100, signaling an extremely overbought condition. This could suggest a potential reversal or consolidation in the near future.
Volatility Analysis:
- Bollinger Bands (BB): The Bollinger Bands have been narrowing, indicating decreasing volatility. A narrowing band often precedes a significant price movement, suggesting a potential breakout in the near future.
Volume Analysis:
- On-Balance Volume (OBV): The OBV has been decreasing over the past 5 days, indicating a divergence between price and volume. This could be a warning sign of a weakening trend.
- Chaikin Money Flow (CMF): The CMF has been negative, indicating selling pressure. This contradicts the bullish price movement and could signal a potential reversal.
Conclusion:
Based on the technical indicators analyzed: - Trend: The stock is in a strong upward trend. - Momentum: The momentum is overbought, suggesting a continuation of the uptrend but also a potential for a reversal or consolidation. - Volatility: The narrowing Bollinger Bands indicate a potential breakout in price. - Volume: The decreasing OBV and negative CMF raise concerns about the sustainability of the uptrend.
Recommendation:
Considering the overall analysis, while the stock has shown strong bullish momentum, the divergence in volume indicators and the extreme overbought conditions suggest a potential correction or consolidation in the near future. Traders should be cautious and consider taking profits or implementing risk management strategies. Keep a close eye on the volume and any signs of reversal in momentum indicators for timely decision-making.