Technical Analysis of SPQ 2024-05-10
Overview:
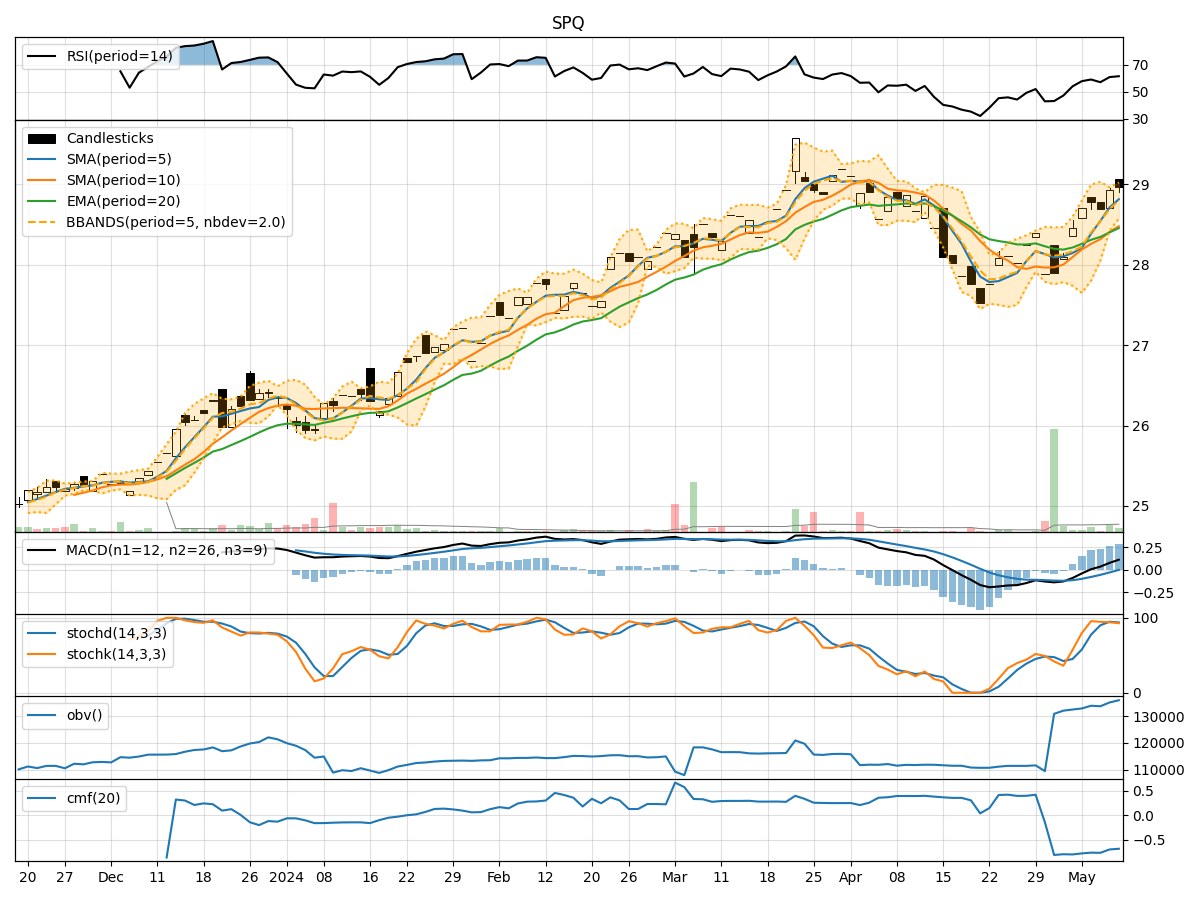
In the last 5 trading days, SPQ stock has shown a mixed performance based on various technical indicators. The trend indicators suggest a slightly bullish sentiment with the moving averages trending upwards. Momentum indicators indicate a neutral to slightly bullish momentum, while volatility indicators show a decreasing trend in volatility. Volume indicators also reflect a slightly negative sentiment with a decrease in On-Balance Volume (OBV) and Chaikin Money Flow (CMF).
Trend Indicators:
- Moving Averages (MA): The 5-day MA has been consistently above the 10-day Simple Moving Average (SMA), indicating a short-term bullish trend. The Exponential Moving Average (EMA) is also trending upwards, supporting a bullish view.
- MACD: The MACD line has been consistently above the signal line, indicating a bullish trend. The MACD Histogram is also in positive territory, further supporting the bullish sentiment.
Momentum Indicators:
- RSI: The Relative Strength Index (RSI) is hovering around 60-65, indicating a neutral to slightly bullish momentum.
- Stochastic Oscillator: Both %K and %D lines are in overbought territory, suggesting a potential reversal or consolidation in the near term.
- Williams %R: The Williams %R is showing oversold conditions, which could signal a potential buying opportunity.
Volatility Indicators:
- Bollinger Bands: The Bollinger Bands are narrowing, indicating decreasing volatility. This could precede a period of consolidation or a breakout in either direction.
Volume Indicators:
- On-Balance Volume (OBV): The OBV has been declining over the last few days, suggesting a decrease in buying pressure.
- Chaikin Money Flow (CMF): The CMF is also negative, indicating a bearish money flow trend.
Conclusion:
Based on the analysis of the technical indicators, the next few days for SPQ stock could see sideways movement or a slight pullback. The trend indicators are bullish, but the momentum indicators suggest a potential reversal or consolidation. The decreasing volatility and negative volume indicators further support a cautious outlook. Traders may consider waiting for more clarity in price action before making significant trading decisions.