Technical Analysis of SPRE 2024-05-10
Overview:
In analyzing the technical indicators for SPRE over the last 5 days, we will delve into the trend, momentum, volatility, and volume indicators to provide a comprehensive outlook on the possible stock price movement in the coming days. By examining these key aspects, we aim to offer valuable insights and predictions to guide your investment decisions.
Trend Analysis:
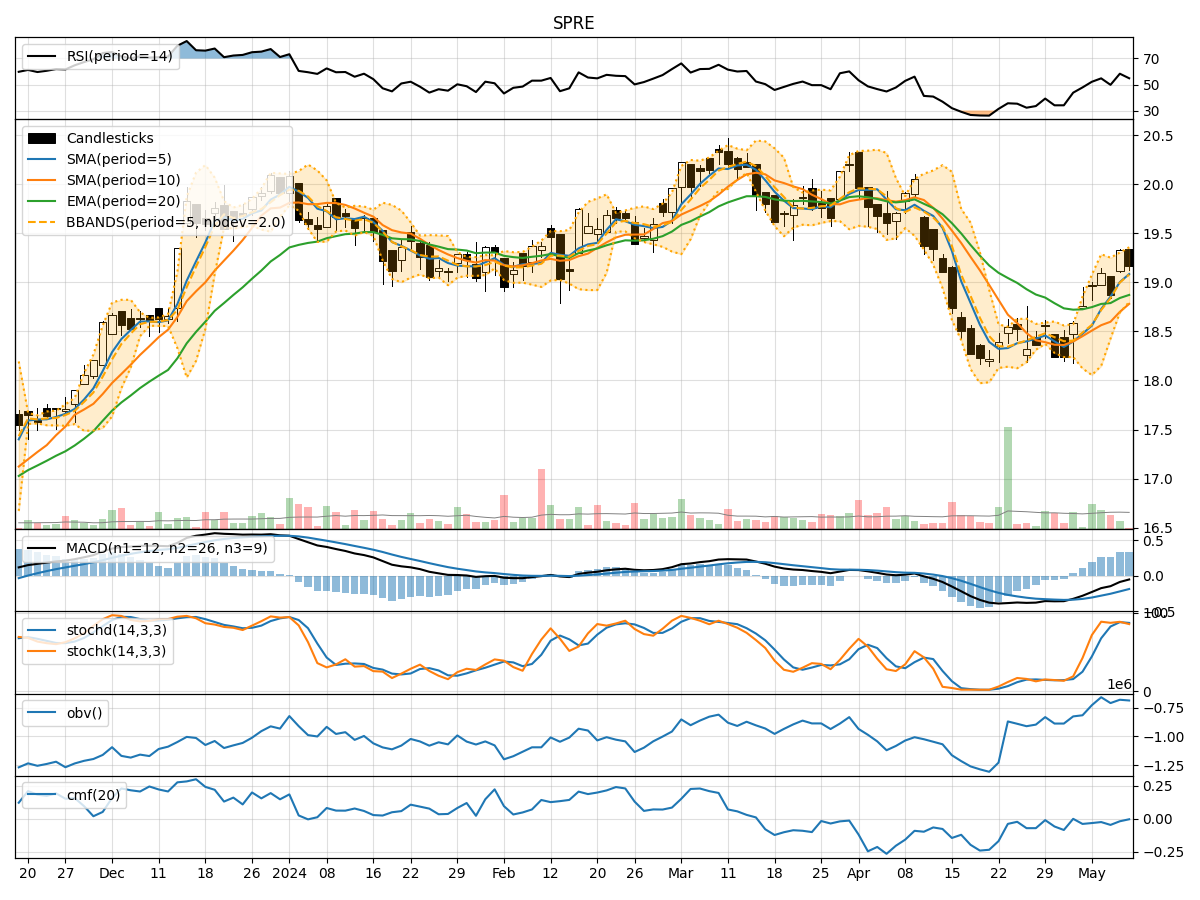
- Moving Averages (MA): The 5-day MA has been consistently above the closing prices, indicating a short-term uptrend.
- MACD: The MACD line has been below the signal line but showing signs of convergence, suggesting a potential reversal in the downtrend.
- RSI: The RSI has been fluctuating around the neutral zone, reflecting indecision in the market sentiment.
Momentum Analysis:
- Stochastic Oscillator: The Stochastic Oscillator has been in the overbought territory, signaling a potential reversal or consolidation.
- Williams %R (WillR): The Williams %R indicator has been fluctuating between overbought and oversold levels, indicating mixed momentum.
Volatility Analysis:
- Bollinger Bands (BB): The Bollinger Bands have been narrowing, suggesting decreasing volatility and a possible period of consolidation.
- Average True Range (ATR): The ATR has been relatively stable, indicating consistent price movements without significant spikes.
Volume Analysis:
- On-Balance Volume (OBV): The OBV has been fluctuating, indicating mixed buying and selling pressure.
- Chaikin Money Flow (CMF): The CMF has been negative, suggesting outflow of money from the stock.
Key Observations:
- The trend indicators show a potential reversal in the short-term downtrend.
- Momentum indicators suggest a mixed sentiment with signs of potential consolidation.
- Volatility indicators point towards a period of decreased volatility and possible sideways movement.
- Volume indicators reflect mixed buying and selling pressure with a negative money flow.
Conclusion:
Based on the analysis of the technical indicators, the stock price of SPRE is likely to experience sideways movement or consolidation in the coming days. The trend indicators hint at a potential reversal in the downtrend, while momentum indicators show mixed signals. Volatility is expected to decrease, leading to a period of consolidation, supported by the volume indicators showing mixed buying and selling pressure. Therefore, it is advisable to exercise caution and closely monitor the price action for any potential breakout or trend confirmation before making significant trading decisions.