Technical Analysis of SPSB 2024-05-10
Overview:
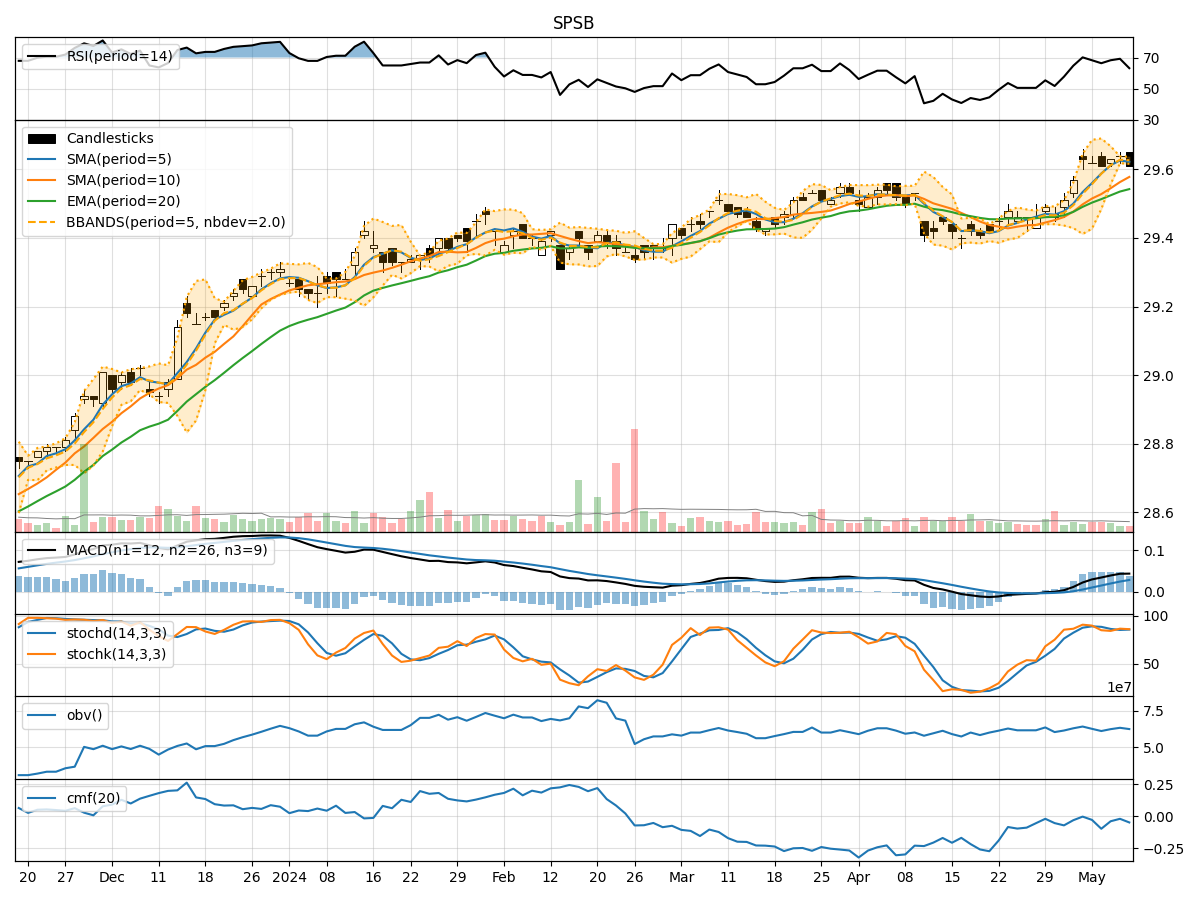
In analyzing the technical indicators for SPSB over the last 5 days, we will delve into the trend, momentum, volatility, and volume indicators to provide a comprehensive outlook on the possible stock price movement. By examining these key indicators, we aim to offer valuable insights and predictions for the upcoming days.
Trend Analysis:
- Moving Averages (MA): The 5-day Moving Average (MA) has been relatively stable around the current price, indicating a neutral trend.
- MACD: The Moving Average Convergence Divergence (MACD) shows a slight positive momentum, with the MACD line consistently above the signal line.
- EMA: The Exponential Moving Average (EMA) has been gradually increasing, suggesting a bullish sentiment in the short term.
Key Observation: The trend indicators point towards a mildly bullish sentiment in the short term.
Momentum Analysis:
- RSI: The Relative Strength Index (RSI) has been fluctuating around the neutral level of 50, indicating a balanced momentum.
- Stochastic Oscillator: Both %K and %D lines of the Stochastic Oscillator are hovering around the overbought territory, suggesting a potential reversal.
- Williams %R: The Williams %R is in the oversold region, indicating a possible buying opportunity.
Key Observation: Momentum indicators suggest a mixed sentiment with a slight bearish bias.
Volatility Analysis:
- Bollinger Bands (BB): The Bollinger Bands are relatively narrow, indicating low volatility in the stock price.
- Bollinger %B: The %B indicator is close to the lower band, suggesting a potential oversold condition.
- Bollinger Band Width: The Band Width is narrow, indicating a period of consolidation.
Key Observation: Volatility indicators signal a period of consolidation and potential price breakout.
Volume Analysis:
- On-Balance Volume (OBV): The OBV has been fluctuating, indicating indecision among market participants.
- Chaikin Money Flow (CMF): The CMF is negative, suggesting a net outflow of money from the stock.
Key Observation: Volume indicators reflect uncertainty and a lack of strong buying or selling pressure.
Conclusion:
Based on the analysis of the technical indicators, the next few days for SPSB could see sideways movement with a slight bullish bias. The trend indicators suggest a short-term bullish sentiment, while momentum indicators indicate a mixed outlook with a bearish bias. Volatility indicators point towards a period of consolidation, potentially preceding a breakout. Volume indicators reflect indecision among investors.
Key Conclusion: Expect sideways movement with a slight bullish bias in the upcoming days for SPSB. Traders should closely monitor key support and resistance levels for potential entry and exit points.