Technical Analysis of SPSM 2024-05-10
Overview:
In analyzing the technical indicators for SPSM over the last 5 days, we will delve into the trend, momentum, volatility, and volume indicators to provide a comprehensive outlook on the possible stock price movement in the coming days. By examining these key indicators, we aim to offer valuable insights and recommendations for potential investors.
Trend Indicators:
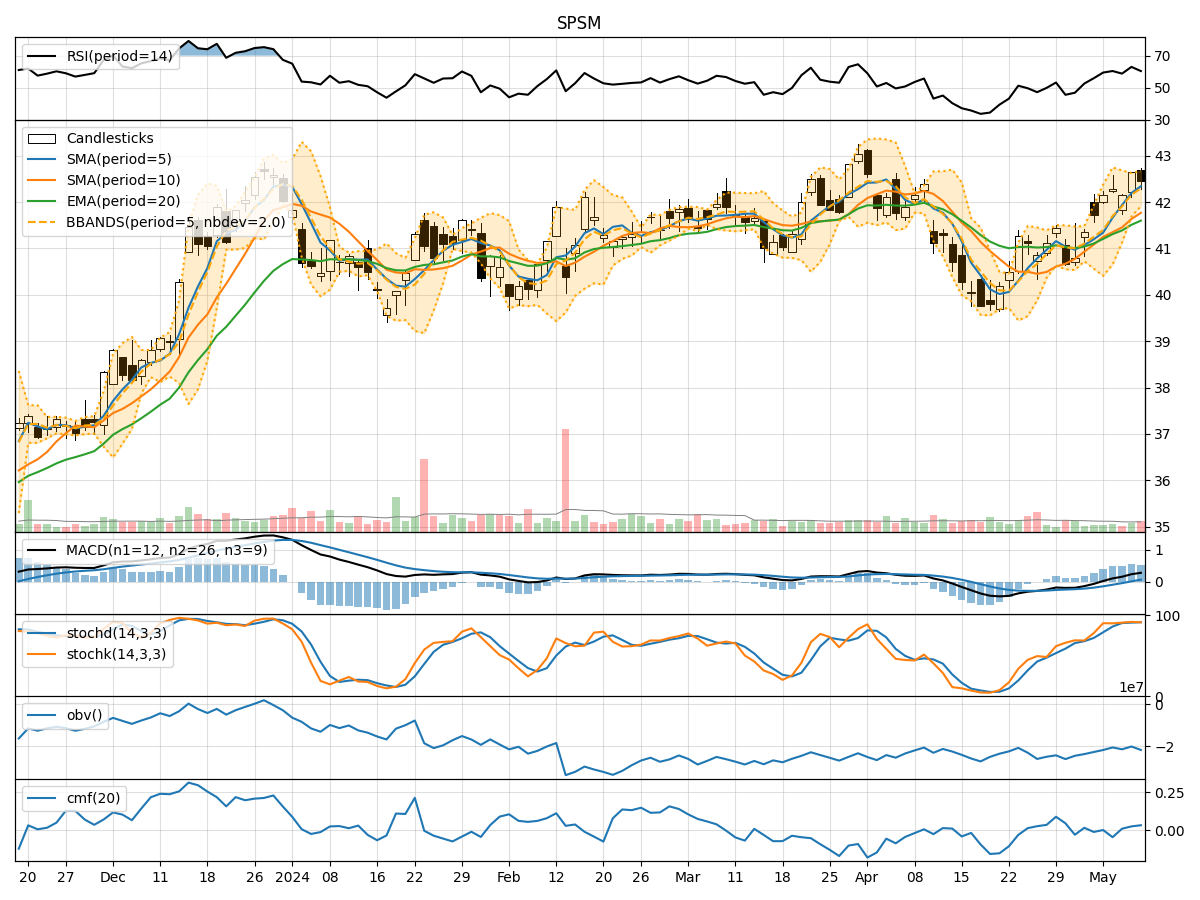
- Moving Averages (MA): The 5-day moving average has been consistently above the longer-term simple moving average (SMA) and exponential moving average (EMA), indicating a short-term bullish trend.
- MACD: The MACD line has been above the signal line for the past few days, suggesting positive momentum in the stock price.
- MACD Histogram: The MACD histogram has been mostly positive, indicating increasing bullish momentum.
Momentum Indicators:
- RSI: The Relative Strength Index (RSI) has been fluctuating around the 60-63 range, indicating moderate momentum without being overbought or oversold.
- Stochastic Oscillator: Both %K and %D lines of the Stochastic Oscillator have been in the overbought territory, suggesting a potential reversal or consolidation.
- Williams %R: The Williams %R has been hovering around -10 to -15, indicating the stock has been in overbought conditions.
Volatility Indicators:
- Bollinger Bands: The stock price has mostly stayed within the Bollinger Bands, with the bands narrowing in recent days, suggesting decreasing volatility.
- Bollinger %B: The %B indicator has been relatively stable, indicating the stock price is trading close to the upper band.
Volume Indicators:
- On-Balance Volume (OBV): The OBV has shown mixed signals, with some days seeing an increase in volume and others a decrease, reflecting uncertainty in investor sentiment.
- Chaikin Money Flow (CMF): The CMF has been slightly positive, indicating some buying pressure in the stock.
Key Observations and Opinions:
- Trend: The stock is currently in an upward trend based on moving averages and MACD analysis.
- Momentum: Momentum indicators suggest the stock may be overbought and could potentially see a reversal or consolidation in the near term.
- Volatility: Volatility has been decreasing, indicating a possible period of consolidation or sideways movement.
- Volume: Volume indicators show mixed signals, reflecting uncertainty in market sentiment.
Conclusion:
Based on the analysis of the technical indicators, the next few days for SPSM could see a potential consolidation or sideways movement as the stock may be overbought and volatility is decreasing. Investors should closely monitor the momentum indicators for any signs of a reversal in the current trend. It is advisable to exercise caution and wait for clearer signals before making any significant trading decisions.