Technical Analysis of SPTL 2024-05-10
Overview:
In analyzing the technical indicators for SPTL over the last 5 days, we will delve into the trend, momentum, volatility, and volume indicators to provide a comprehensive outlook on the possible stock price movement in the coming days. By examining these key aspects, we aim to offer valuable insights and recommendations for potential investors.
Trend Analysis:
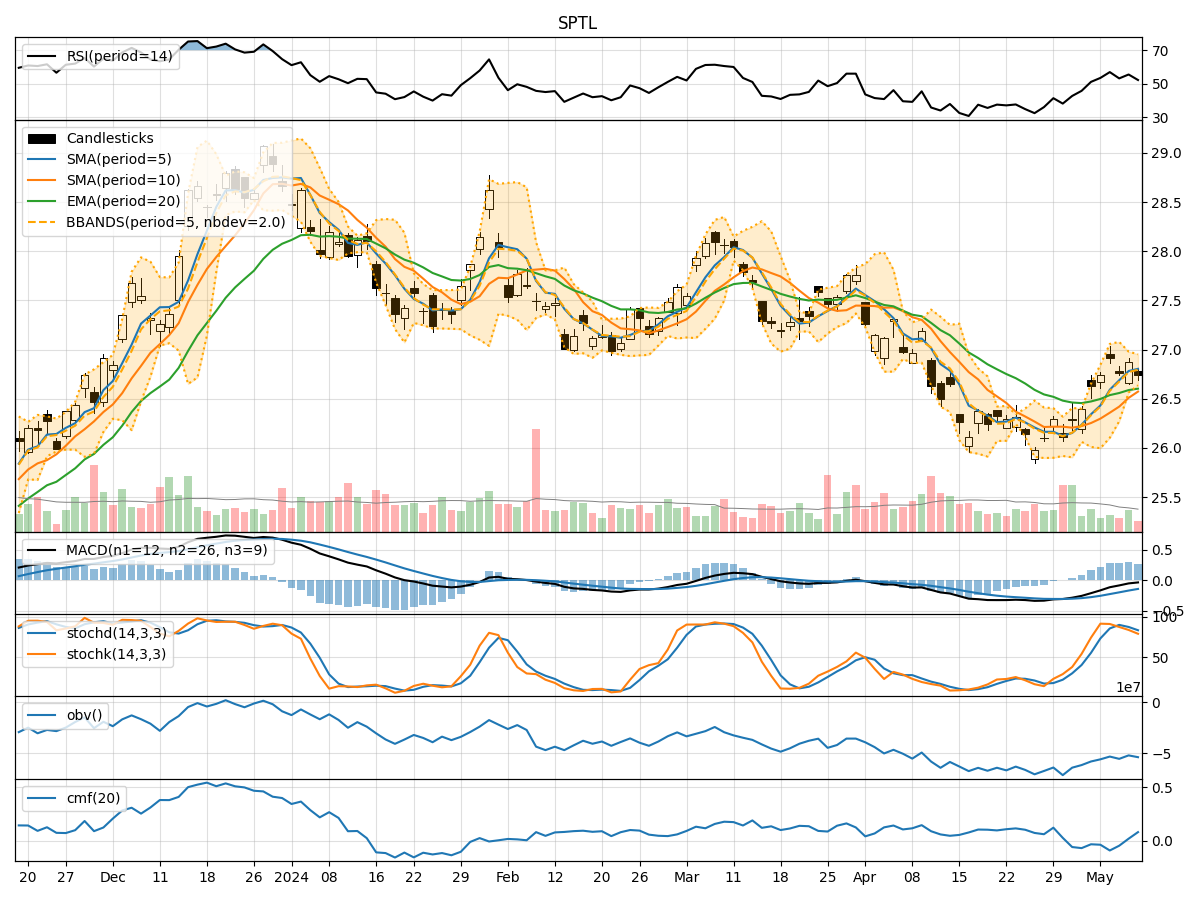
- Moving Averages (MA): The 5-day Moving Average (MA) has been relatively stable around the closing prices, indicating a consistent trend.
- MACD: The Moving Average Convergence Divergence (MACD) has shown a negative trend, with the MACD line consistently below the signal line.
- EMA: The Exponential Moving Average (EMA) has been slightly declining, suggesting a weakening trend.
Key Observation: The trend indicators point towards a slightly bearish sentiment in the short term.
Momentum Analysis:
- RSI: The Relative Strength Index (RSI) has been fluctuating around the neutral zone, indicating indecision in the market.
- Stochastic Oscillator: Both %K and %D have been decreasing, signaling a potential downward momentum.
- Williams %R: The Williams %R is in the oversold territory, suggesting a possible reversal.
Key Observation: The momentum indicators suggest a bearish momentum in the near future.
Volatility Analysis:
- Bollinger Bands: The Bollinger Bands have been narrowing, indicating decreasing volatility in the stock price.
- Bollinger %B: The %B is relatively low, suggesting a potential buying opportunity.
- Average True Range (ATR): The ATR has been decreasing, reflecting reduced price volatility.
Key Observation: Volatility indicators point towards a consolidation phase with a potential breakout in either direction.
Volume Analysis:
- On-Balance Volume (OBV): The OBV has shown mixed signals, with fluctuations in volume accumulation.
- Chaikin Money Flow (CMF): The CMF has been negative, indicating selling pressure in the market.
Key Observation: Volume indicators suggest a neutral to bearish sentiment in terms of volume flow.
Conclusion:
Based on the analysis of trend, momentum, volatility, and volume indicators, the overall outlook for SPTL in the next few days leans towards a bearish sentiment. The trend indicators show a weakening trend, while momentum indicators signal a downward momentum. Volatility indicators point towards a consolidation phase, and volume indicators suggest a neutral to bearish volume flow.
Therefore, the possible stock price movement for the next few days is likely to be on a downward trajectory. Investors should exercise caution and consider potential short-term selling opportunities or wait for a clearer trend reversal signal before considering long positions.