Technical Analysis of SPTS 2024-05-10
Overview:
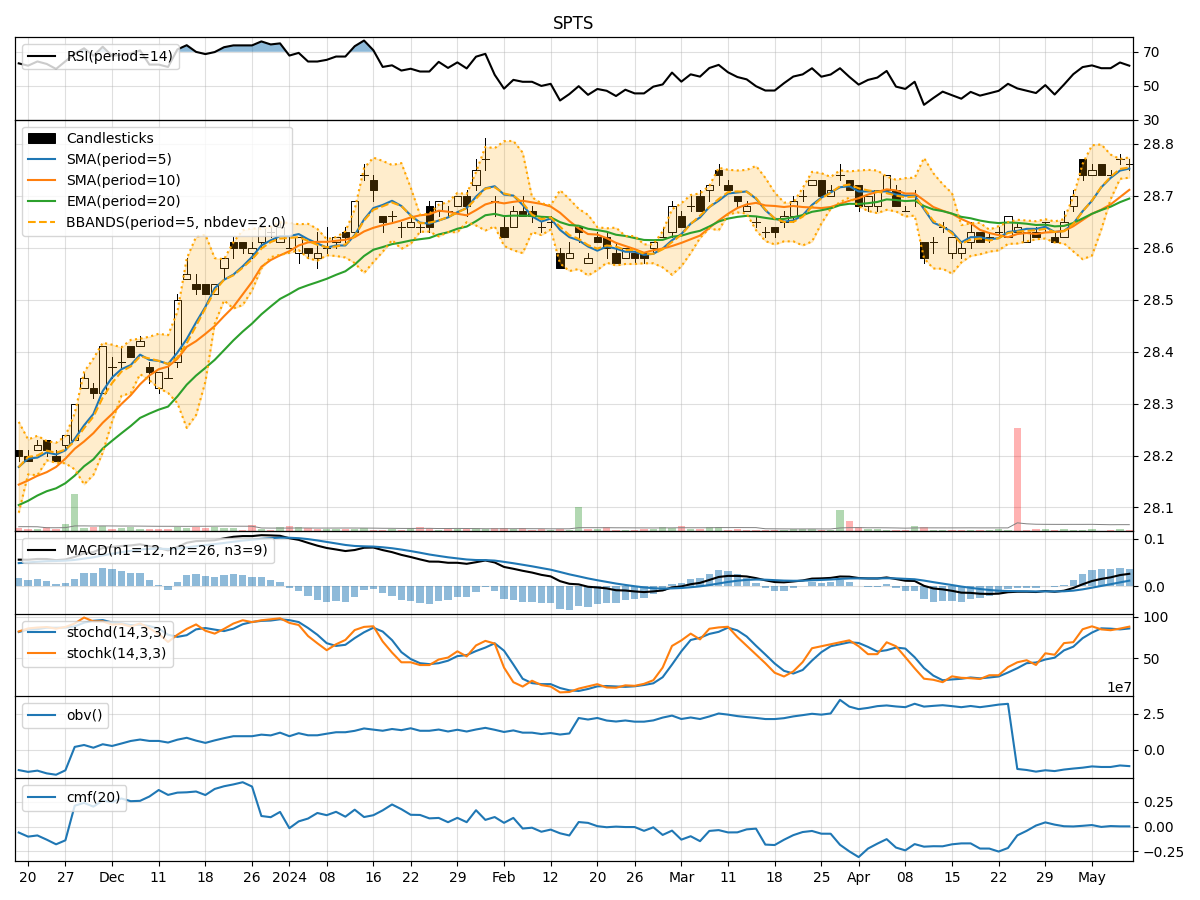
In the last 5 trading days, the stock price of SPTS has been relatively stable, hovering around the $28.75 mark. Various technical indicators have been analyzed to provide insights into the potential future price movement of SPTS. The analysis covers trend indicators, momentum indicators, volatility indicators, and volume indicators.
Trend Indicators:
- Moving Averages (MA): The 5-day MA has been consistently above the closing price, indicating a short-term uptrend.
- MACD: The MACD line has been trending upwards, suggesting bullish momentum.
- MACD Histogram: The histogram has been increasing, indicating strengthening bullish momentum.
Key Observation: The trend indicators suggest a bullish sentiment in the short term.
Momentum Indicators:
- RSI: The RSI has been fluctuating around the 60-65 range, indicating a neutral to slightly bullish momentum.
- Stochastic Oscillator: Both %K and %D have been in the overbought territory, suggesting a potential reversal.
- Williams %R: The indicator has been hovering around oversold levels, indicating a potential buying opportunity.
Key Observation: Momentum indicators show mixed signals, with a slight bias towards a bearish reversal.
Volatility Indicators:
- Bollinger Bands: The bands have been relatively narrow, indicating low volatility.
- Bollinger %B: The %B has been fluctuating around the midline, suggesting a balanced market sentiment.
Key Observation: Volatility indicators point towards a period of consolidation and range-bound trading.
Volume Indicators:
- On-Balance Volume (OBV): The OBV has been relatively flat, indicating a balance between buying and selling pressure.
- Chaikin Money Flow (CMF): The CMF has been close to zero, suggesting a lack of strong buying or selling pressure.
Key Observation: Volume indicators reflect a lack of significant accumulation or distribution.
Conclusion:
Based on the analysis of the technical indicators: - Trend: The trend indicators suggest an upward bias in the short term. - Momentum: Momentum indicators show mixed signals with a slight bearish bias. - Volatility: Volatility indicators indicate a period of consolidation and low volatility. - Volume: Volume indicators reflect a balanced market sentiment with no clear accumulation or distribution.
Overall Assessment:
Considering the technical indicators collectively, the next few days for SPTS are likely to see sideways movement with a slight bullish bias. Traders should watch for potential reversals indicated by the stochastic oscillator and Williams %R, while also being mindful of the low volatility environment suggested by the Bollinger Bands. It is advisable to closely monitor price action and key support/resistance levels for potential trading opportunities.