Technical Analysis of SPUC 2024-05-10
Overview:
In analyzing the technical indicators for SPUC stock over the last 5 days, we will delve into the trend, momentum, volatility, and volume indicators to provide a comprehensive outlook on the possible stock price movement in the coming days. By examining these key aspects, we aim to offer valuable insights and predictions to guide your investment decisions.
Trend Indicators:
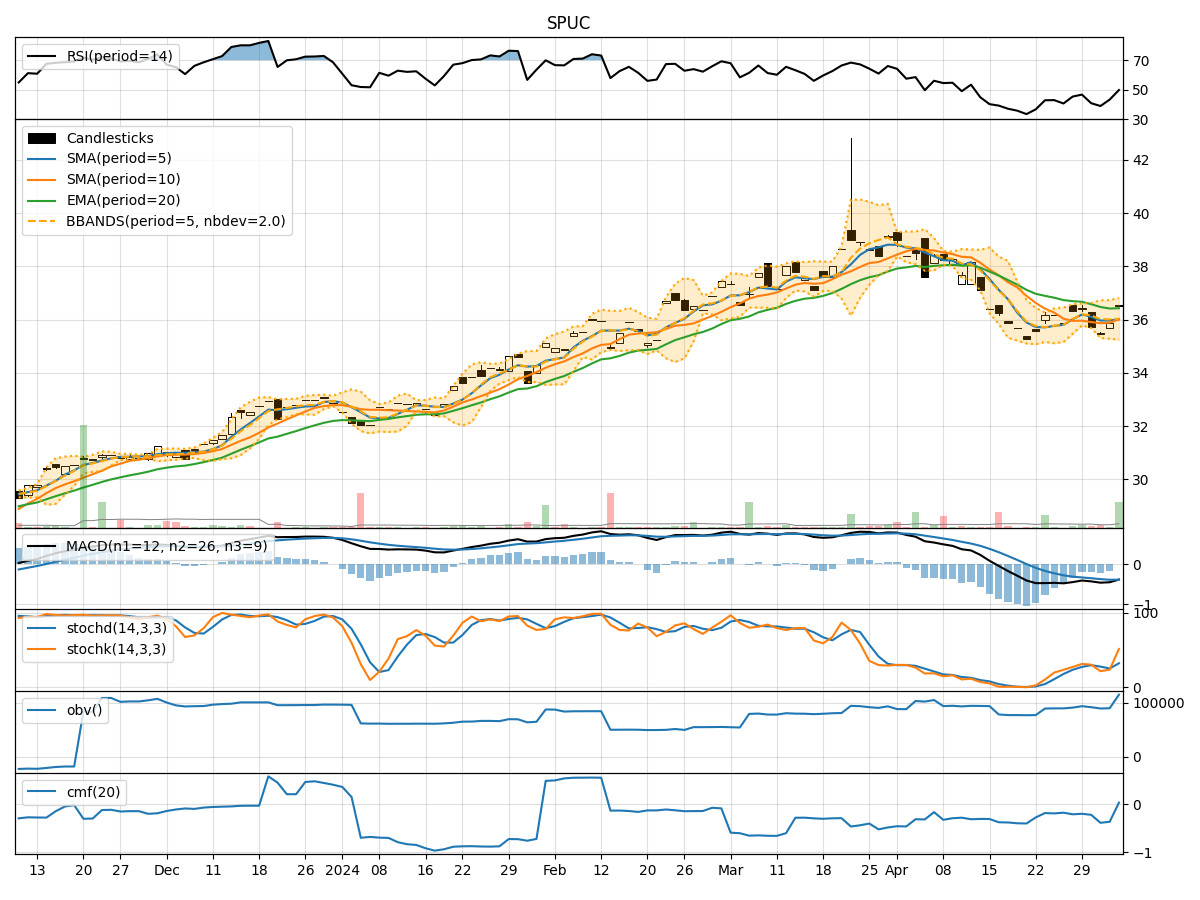
- Moving Averages (MA): The 5-day moving average has been consistently rising, indicating a bullish trend in the short term.
- MACD: The MACD line has been increasing, crossing above the signal line, suggesting a bullish momentum.
- RSI: The RSI is in the neutral zone, not indicating overbought or oversold conditions.
Momentum Indicators:
- Stochastic Oscillator: Both %K and %D are at extremely high levels, signaling potential overbought conditions.
- Williams %R: The indicator is at 0, indicating a potential overbought situation.
Volatility Indicators:
- Bollinger Bands: The bands have been narrowing, suggesting decreasing volatility and a possible period of consolidation.
- BB% (Bollinger Band %B): The %B is above 0.8, indicating a potential overbought condition.
Volume Indicators:
- On-Balance Volume (OBV): The OBV has been relatively flat, not showing significant accumulation or distribution.
- Chaikin Money Flow (CMF): The CMF is positive but has not shown strong buying pressure.
Key Observations and Opinions:
- Trend: The trend indicators suggest a bullish sentiment in the short term.
- Momentum: Momentum indicators point towards potential overbought conditions, indicating a possible reversal or consolidation.
- Volatility: Volatility indicators signal decreasing volatility and a period of consolidation.
- Volume: Volume indicators do not show strong confirmation of the current price trend.
Conclusion:
Based on the analysis of the technical indicators, the next few days for SPUC stock could see a potential consolidation phase with a slight bias towards a bearish reversal. Traders should exercise caution as the stock may experience a pullback from overbought levels. It is advisable to closely monitor key support and resistance levels for potential entry or exit points.