Technical Analysis of SPUU 2024-05-10
Overview:
In analyzing the technical indicators for SPUU over the last 5 days, we will delve into the trend, momentum, volatility, and volume indicators to provide a comprehensive outlook on the possible stock price movement in the coming days. By examining these key aspects, we aim to offer valuable insights and recommendations for potential investors.
Trend Analysis:
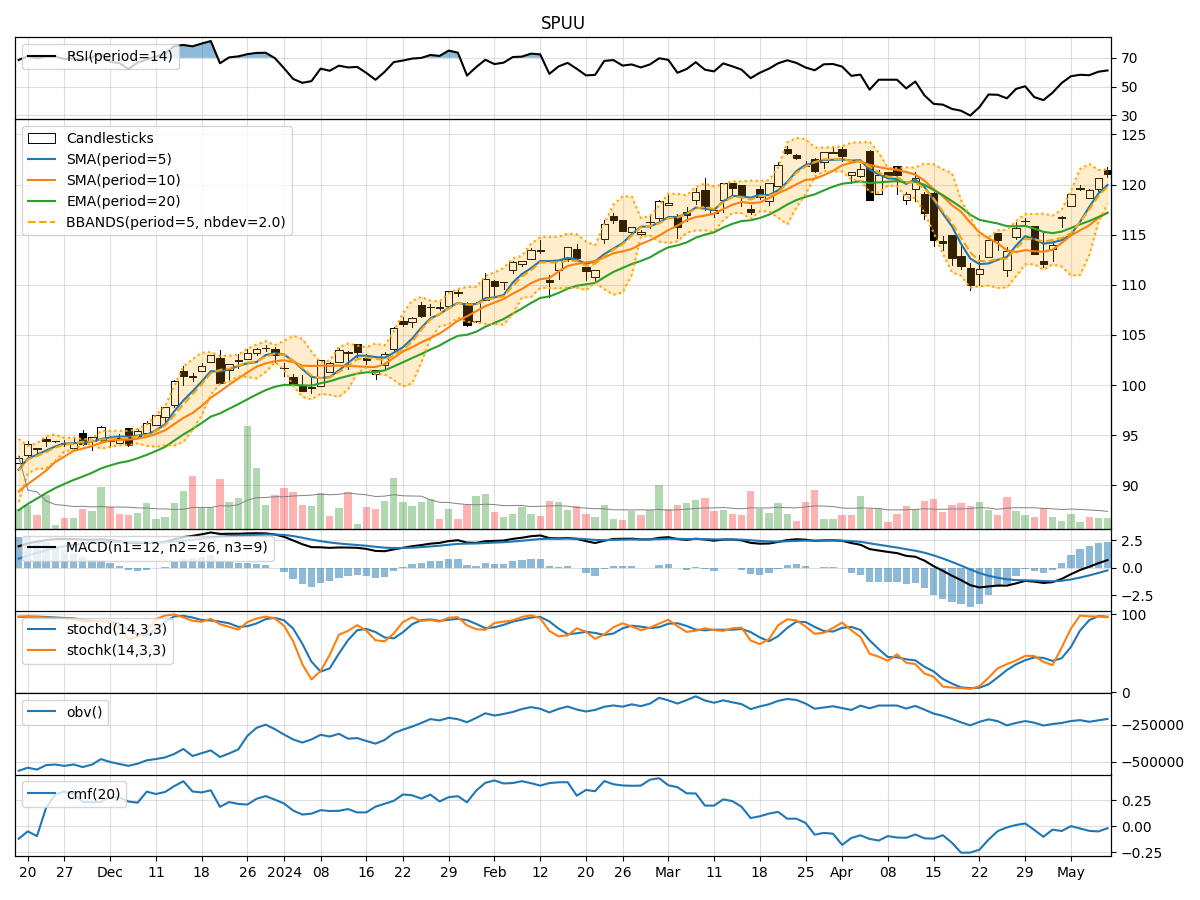
- Moving Averages (MA): The 5-day Moving Average has been consistently rising, indicating a bullish trend in the short term.
- MACD: The MACD line has been above the signal line for the past 5 days, suggesting a bullish momentum.
- EMA: The Exponential Moving Average has also been trending upwards, supporting the bullish sentiment.
Momentum Analysis:
- RSI: The Relative Strength Index has been increasing, showing strengthening buying momentum.
- Stochastic Oscillator: Both %K and %D have been high, indicating an overbought condition.
- Williams %R: The indicator has been in the oversold territory, suggesting a potential reversal.
Volatility Analysis:
- Bollinger Bands: The bands have been narrowing, indicating decreasing volatility and a possible consolidation phase.
- Bollinger %B: The %B indicator has been hovering around 0.8, suggesting a relatively high price compared to recent movements.
Volume Analysis:
- On-Balance Volume (OBV): The OBV has been fluctuating but generally showing a slight decrease, indicating some distribution.
- Chaikin Money Flow (CMF): The CMF has been negative, signaling outflows and potential bearish pressure.
Key Observations:
- The trend indicators suggest a strong bullish sentiment in the short term.
- Momentum indicators show a mix of overbought and oversold conditions, indicating a potential reversal or consolidation.
- Volatility is decreasing, pointing towards a possible period of consolidation.
- Volume indicators reflect some distribution and bearish pressure.
Conclusion:
Based on the analysis of the technical indicators, the stock price of SPUU is likely to experience a short-term consolidation phase with a potential for a slight pullback due to the overbought conditions indicated by the momentum indicators and the negative CMF. However, the overall trend remains bullish, supported by the moving averages and MACD. Investors should closely monitor the price action for potential entry points during the consolidation phase, keeping in mind the possibility of a resumption of the bullish trend once the overbought conditions are alleviated.