Technical Analysis of SPVM 2024-05-10
Overview:
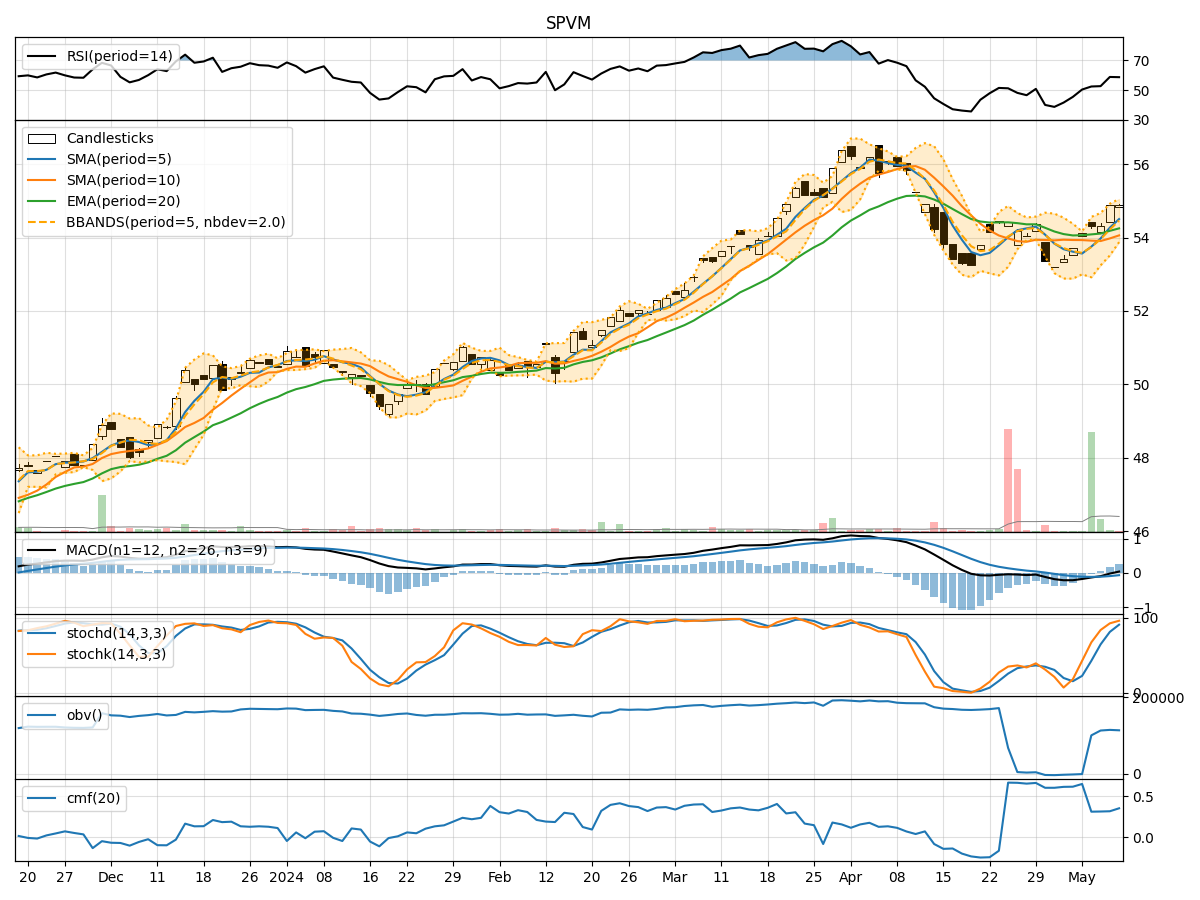
In the last 5 trading days, SPVM has shown a relatively stable performance with minor fluctuations in price and volume. The trend indicators suggest a slight uptrend, supported by the moving averages and MACD. Momentum indicators indicate a strengthening momentum, with RSI and stochastic oscillators showing bullish signals. Volatility indicators show a moderate level of volatility, while volume indicators suggest a neutral to slightly positive sentiment.
Trend Indicators Analysis:
- Moving Averages (MA): The 5-day MA is above the 10-day SMA, indicating a short-term bullish trend. The EMA(20) is also showing an upward trend, supporting a positive outlook.
- MACD: The MACD line is above the signal line, indicating a bullish momentum. The MACD histogram is also in positive territory, suggesting upward momentum.
Momentum Indicators Analysis:
- RSI: The RSI is in the neutral zone but trending upwards, indicating a potential bullish momentum building up.
- Stochastic Oscillators: Both %K and %D are in overbought territory, suggesting a strong bullish momentum.
- Williams %R: The indicator is close to the oversold region, indicating a potential buying opportunity.
Volatility Indicators Analysis:
- Bollinger Bands (BB): The price is within the bands, suggesting a moderate level of volatility. The bands are not significantly expanding or contracting, indicating a stable price movement.
Volume Indicators Analysis:
- On-Balance Volume (OBV): The OBV has been slightly negative, indicating some distribution. However, the CMF(20) is positive, suggesting a potential accumulation phase.
Key Observations:
- The trend indicators support a bullish outlook, with moving averages and MACD signaling an uptrend.
- Momentum indicators show a strong bullish momentum building up, especially with stochastic oscillators in overbought territory.
- Volatility is moderate, indicating stable price movements without significant fluctuations.
- Volume indicators suggest a neutral to slightly positive sentiment, with OBV showing slight distribution but CMF indicating accumulation.
Conclusion:
Based on the analysis of technical indicators, the next few days for SPVM are likely to see continued upward movement. The bullish trend supported by moving averages and MACD, coupled with strong momentum signals from RSI and stochastic oscillators, indicates a positive outlook. The moderate volatility and neutral to slightly positive volume sentiment further support this view. Traders and investors may consider buying opportunities in SPVM for potential short to medium-term gains.