Technical Analysis of SPVU 2024-05-10
Overview:
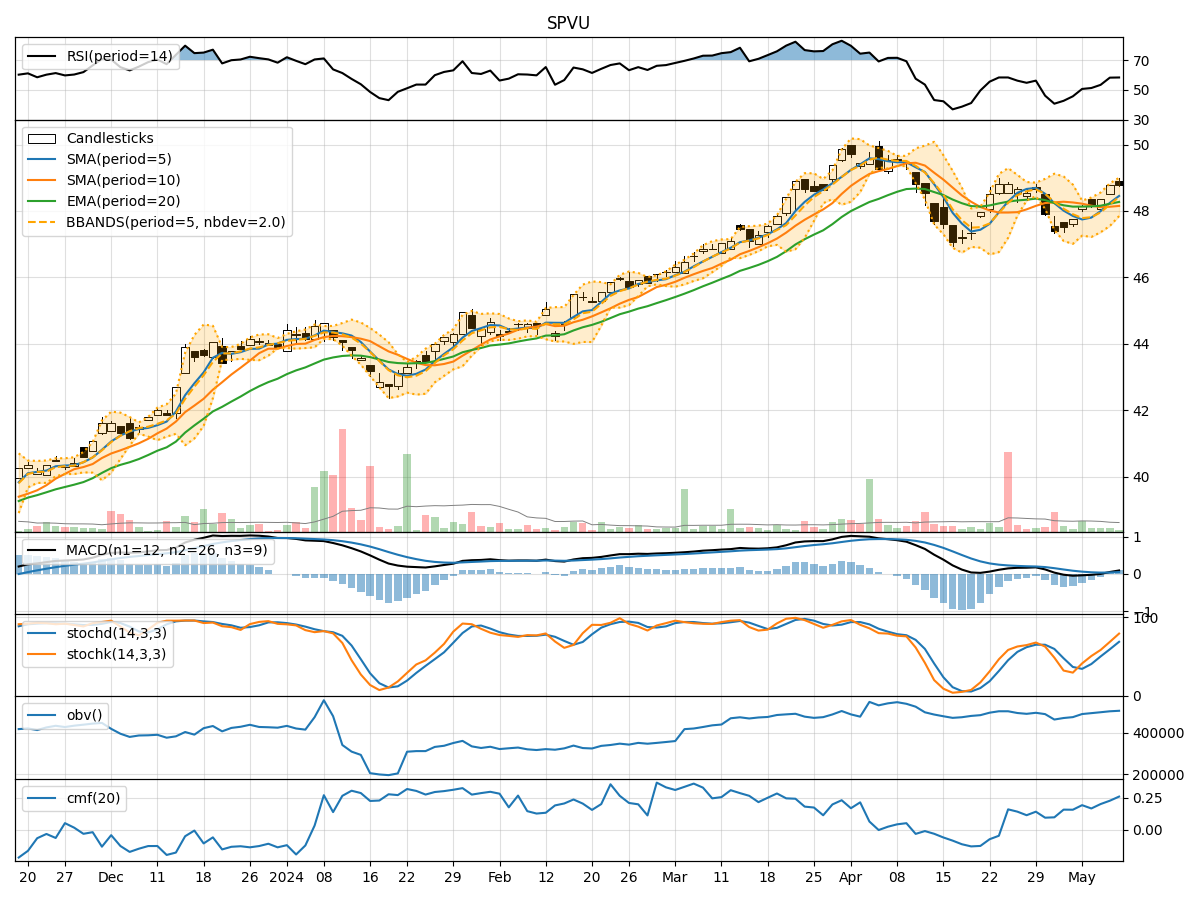
In analyzing the technical indicators for SPVU over the last 5 days, we will delve into the trend, momentum, volatility, and volume indicators to provide a comprehensive outlook on the possible stock price movement in the coming days. By examining these key indicators, we aim to offer valuable insights and predictions to guide your investment decisions.
Trend Analysis:
- Moving Averages (MA): The 5-day MA has been showing an upward trend, indicating a positive momentum in the stock price.
- MACD: The MACD line has been consistently above the signal line, suggesting a bullish trend in the stock.
- EMA: The EMA has been trending upwards, further supporting the bullish sentiment in the stock.
Momentum Analysis:
- RSI: The RSI has been gradually increasing, indicating strengthening buying pressure in the stock.
- Stochastic Oscillator: Both %K and %D lines of the Stochastic Oscillator have been rising, signaling increasing momentum in the stock price.
- Williams %R: The Williams %R is in the oversold territory, suggesting a potential reversal in the stock price.
Volatility Analysis:
- Bollinger Bands (BB): The stock price has been trading within the upper Bollinger Band, indicating a period of high volatility.
- Bollinger Band Width (BBW): The BBW has been relatively stable, suggesting consistent volatility levels in the stock.
Volume Analysis:
- On-Balance Volume (OBV): The OBV has been steadily increasing, indicating strong buying volume in the stock.
- Chaikin Money Flow (CMF): The CMF has been positive, reflecting a healthy inflow of money into the stock.
Key Observations:
- The trend indicators, momentum indicators, and volume indicators all point towards a bullish sentiment in the stock.
- The volatility has been relatively stable, with the stock price trading within the upper Bollinger Band.
- The increasing OBV and positive CMF further support the bullish outlook for the stock.
Conclusion:
Based on the analysis of the technical indicators, it is highly likely that the stock price of SPVU will continue its upward trajectory in the coming days. Investors may consider buying or holding positions in the stock to capitalize on the expected bullish movement. It is essential to monitor the indicators closely for any signs of reversal or consolidation in the future.