Technical Analysis of SPWO 2024-05-10
Overview:
In analyzing the technical indicators for SPWO over the last 5 days, we will delve into the trend, momentum, volatility, and volume indicators to provide a comprehensive outlook on the possible stock price movement in the coming days. By examining these key aspects, we aim to offer valuable insights and predictions to guide your investment decisions.
Trend Indicators:
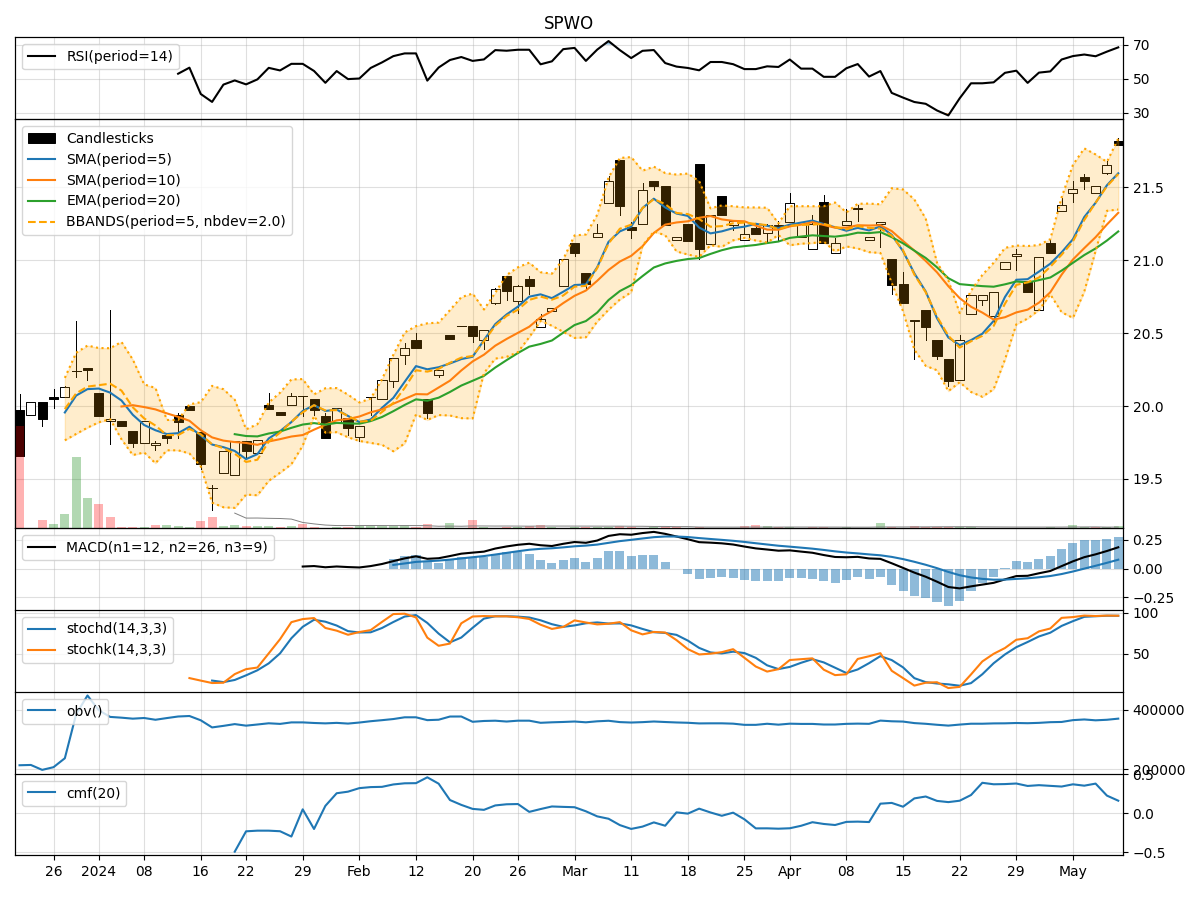
- Moving Averages (MA): The 5-day MA has been consistently above the 10-day SMA, indicating a short-term bullish trend. The EMA(20) has been steadily increasing, reflecting positive momentum.
- MACD: The MACD line has been above the signal line for the past 5 days, suggesting bullish momentum.
- MACD Histogram: The MACD histogram has been consistently positive, indicating increasing bullish momentum.
Momentum Indicators:
- RSI: The RSI has been trending upwards and is currently in the overbought territory, suggesting a strong bullish momentum.
- Stochastic Oscillator: Both %K and %D lines of the Stochastic Oscillator are in the overbought zone, indicating a potential reversal or consolidation.
- Williams %R: The Williams %R is in the oversold region, signaling a potential reversal to the upside.
Volatility Indicators:
- Bollinger Bands: The stock price has been trading within the upper Bollinger Band, indicating an overbought condition. The bands are relatively narrow, suggesting low volatility.
- Bollinger %B: The %B indicator is above 0.8, indicating a potential overbought situation.
Volume Indicators:
- On-Balance Volume (OBV): The OBV has shown mixed signals over the past 5 days, with alternating positive and negative values.
- Chaikin Money Flow (CMF): The CMF(20) has been fluctuating but generally trending downwards, indicating potential selling pressure.
Key Observations and Opinions:
- Trend: The trend indicators suggest a strong bullish sentiment in the short term.
- Momentum: Momentum indicators indicate a potential overbought condition, signaling a need for caution.
- Volatility: Volatility indicators point towards a period of low volatility, potentially leading to a consolidation phase.
- Volume: Volume indicators show mixed signals, reflecting uncertainty in market participation.
Conclusion:
Based on the analysis of the technical indicators, the stock price of SPWO is likely to experience a short-term consolidation or pullback in the coming days. The overbought conditions indicated by momentum indicators and the narrowing Bollinger Bands suggest a potential reversal or sideways movement. Traders should exercise caution and consider taking profits or implementing risk management strategies in anticipation of a possible downward correction.