Technical Analysis of SPXL 2024-05-10
Overview:
In analyzing the technical indicators for SPXL over the last 5 days, we will delve into the trend, momentum, volatility, and volume indicators to provide a comprehensive outlook on the possible stock price movement in the coming days. By examining these key aspects, we aim to offer valuable insights and predictions for potential investors.
Trend Indicators:
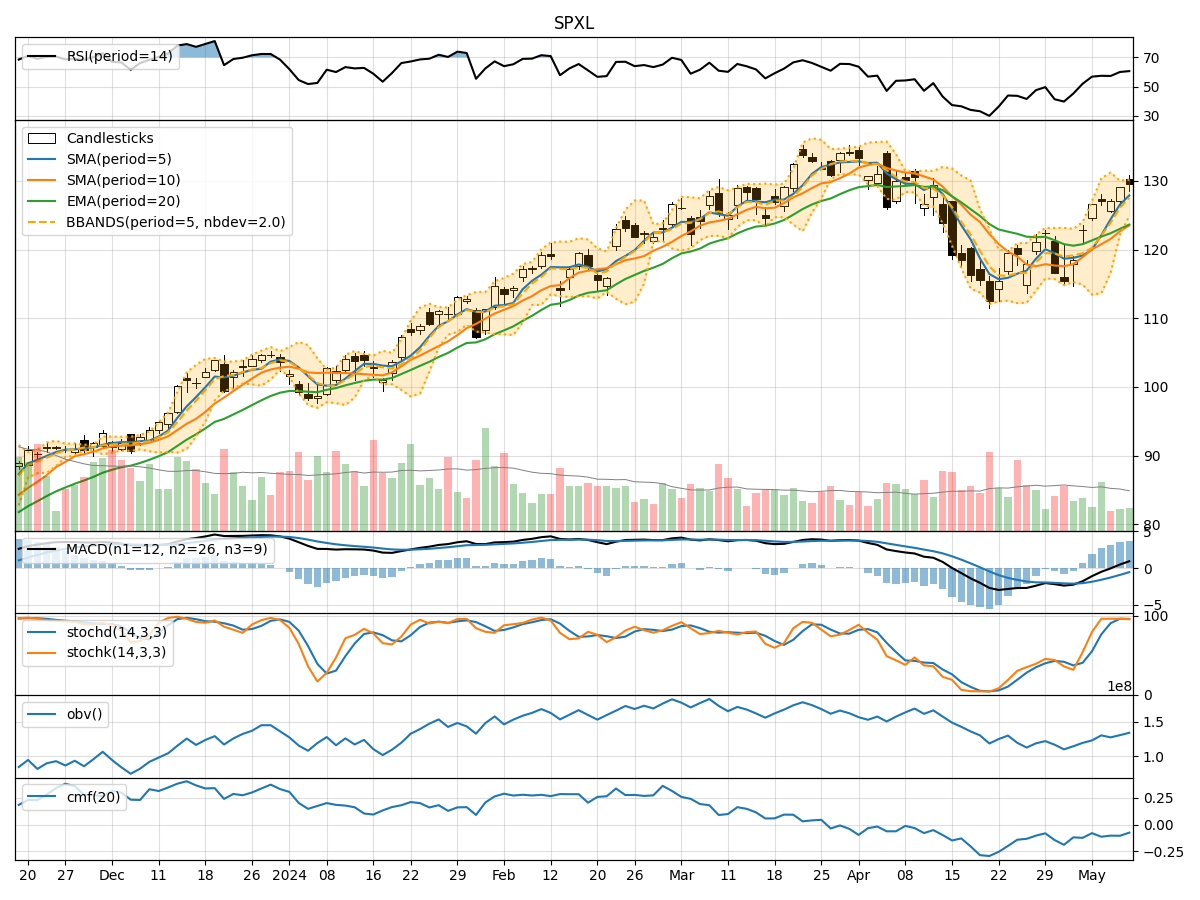
- Moving Averages (MA): The 5-day moving average has been consistently above the simple moving average (SMA) and exponential moving average (EMA), indicating a bullish trend.
- MACD: The MACD line has been consistently above the signal line, suggesting bullish momentum in the stock price.
- Conclusion: The trend indicators point towards an upward trend in the stock price.
Momentum Indicators:
- RSI: The Relative Strength Index (RSI) has been gradually increasing and is currently in the overbought territory, indicating strong buying momentum.
- Stochastic Oscillator: Both %K and %D have been consistently high, signaling strong upward momentum.
- Conclusion: Momentum indicators suggest a bullish sentiment in the stock.
Volatility Indicators:
- Bollinger Bands: The stock price has been trading close to the upper Bollinger Band, indicating high volatility and potential overbought conditions.
- Conclusion: Volatility indicators suggest a high volatility environment, which could lead to sharp price movements.
Volume Indicators:
- On-Balance Volume (OBV): The OBV has been decreasing over the last 5 days, indicating a divergence between price and volume, which could signal a potential reversal.
- Chaikin Money Flow (CMF): The CMF has been negative, indicating selling pressure in the stock.
- Conclusion: Volume indicators suggest a bearish sentiment in the stock.
Conclusion:
Based on the analysis of trend, momentum, volatility, and volume indicators, the overall outlook for SPXL in the next few days is as follows: - Trend: Upward - Momentum: Bullish - Volatility: High volatility - Volume: Bearish
Final Recommendation:
Considering the mixed signals from the different indicators, it is crucial for investors to proceed with caution. While the trend and momentum indicators are positive, the high volatility and bearish volume signals warrant careful monitoring. Investors should consider setting tight stop-loss levels to manage risk effectively. Overall, a cautious bullish view is recommended with close monitoring of key support and resistance levels.