Technical Analysis of SPXN 2024-05-10
Overview:
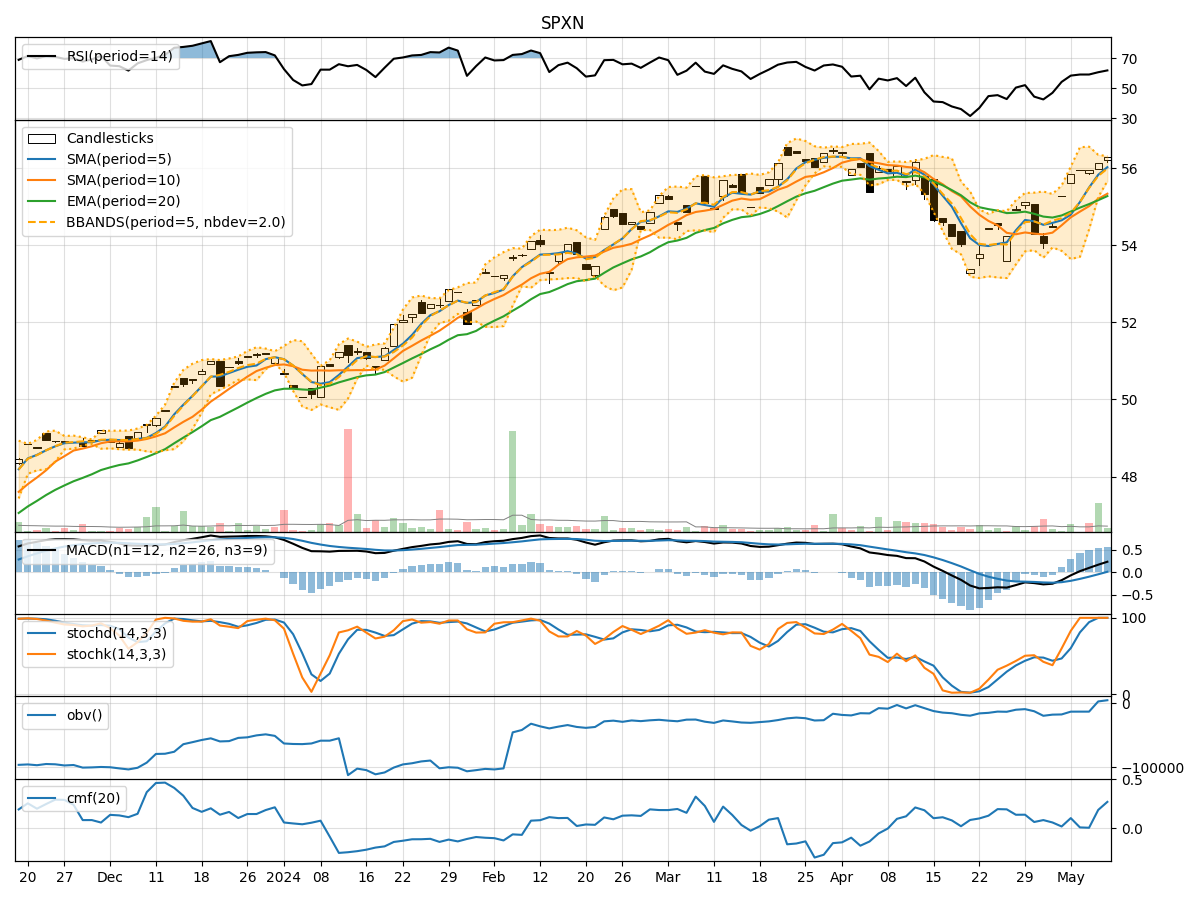
In the last 5 trading days, SPXN has shown a consistent uptrend in its price, supported by positive momentum and volume indicators. The volatility has been relatively stable, indicating a controlled price movement. The technical indicators suggest a bullish sentiment in the market.
Trend Analysis:
- Moving Averages (MA): The 5-day Moving Average has been consistently above the Simple Moving Average (SMA) and Exponential Moving Average (EMA), indicating a short-term bullish trend.
- MACD: The MACD line has been consistently above the signal line, with both lines showing an upward trend, indicating a bullish momentum.
- MACD Histogram: The MACD Histogram has been increasing over the last 5 days, indicating strengthening bullish momentum.
Momentum Analysis:
- RSI: The Relative Strength Index (RSI) has been increasing and is currently in the overbought territory, suggesting a strong bullish momentum.
- Stochastic Oscillator: Both %K and %D lines of the Stochastic Oscillator are at 100, indicating a strong bullish momentum.
- Williams %R: The Williams %R is at 0, indicating an overbought condition.
Volatility Analysis:
- Bollinger Bands: The Bollinger Bands have been relatively narrow, suggesting low volatility in the stock price movement.
- Bollinger %B: The %B indicator is above 0.8, indicating that the price is close to the upper Bollinger Band, which could signal a potential overbought condition.
Volume Analysis:
- On-Balance Volume (OBV): The OBV has been steadily increasing over the last 5 days, indicating strong buying pressure.
- Chaikin Money Flow (CMF): The CMF is positive and has been increasing, indicating that money is flowing into the stock.
Conclusion:
Based on the analysis of the technical indicators, the next few days are likely to see continued upward movement in the stock price of SPXN. The trend indicators, momentum indicators, and volume indicators all point towards a bullish sentiment in the market. However, caution should be exercised as some indicators are in the overbought territory, such as RSI and Williams %R. Traders and investors should closely monitor the price action and be prepared for potential profit-taking or a temporary pullback in the near future.