Technical Analysis of SPXS 2024-05-03
Overview:
In analyzing the technical indicators for SPXS over the last 5 days, we will delve into the trend, momentum, volatility, and volume indicators to provide a comprehensive outlook on the possible stock price movement in the coming days. By examining these key aspects, we aim to offer valuable insights and predictions for informed decision-making.
Trend Analysis:
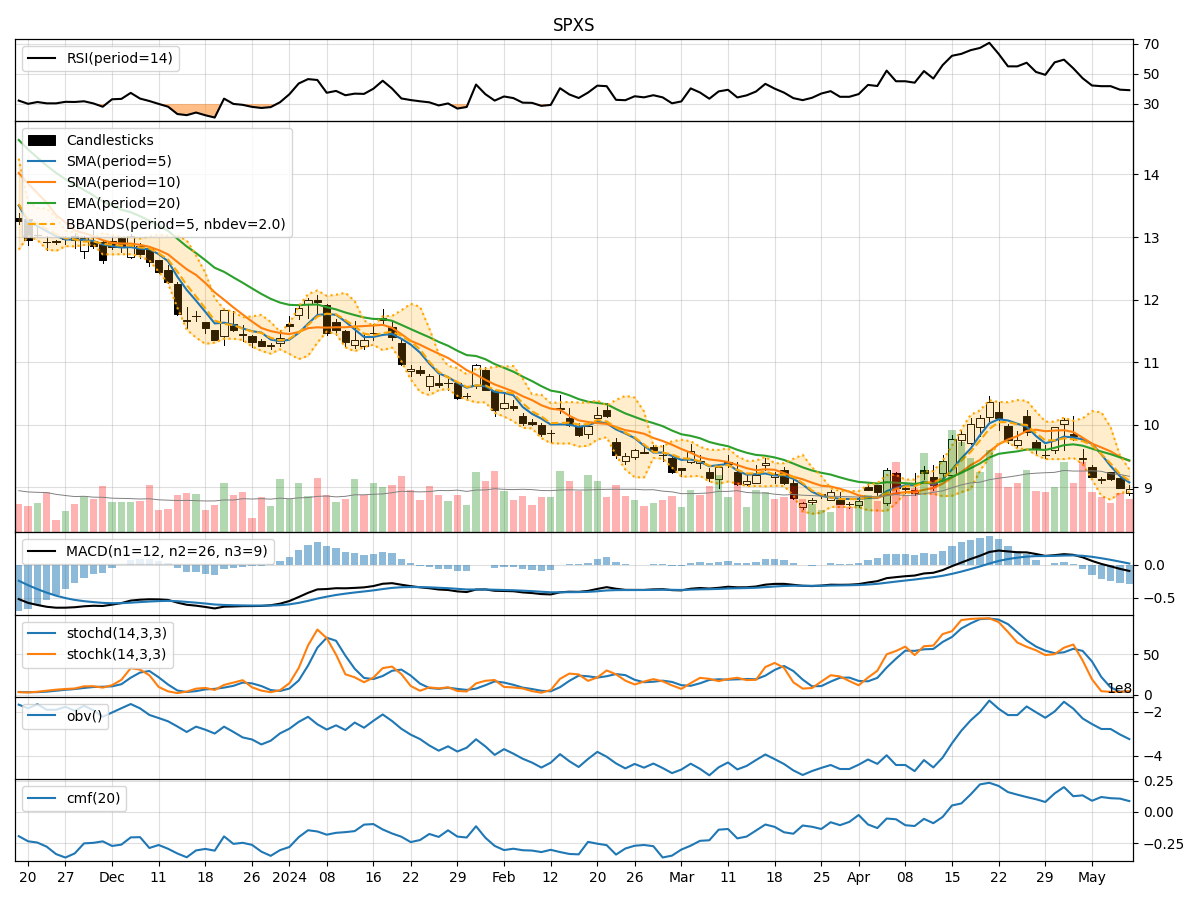
- Moving Averages (MA): The 5-day MA has been fluctuating around the actual closing prices, indicating a lack of clear trend direction.
- MACD: The MACD line has been hovering around the signal line, suggesting a neutral momentum in the short term.
- EMA: The EMA has been slightly increasing, indicating a potential bullish sentiment in the market.
Momentum Analysis:
- RSI: The RSI values have been fluctuating around the mid-level, indicating a balanced momentum between buying and selling pressure.
- Stochastic Oscillator: The Stochastics have shown mixed signals, with occasional overbought and oversold conditions, reflecting indecision in the market sentiment.
Volatility Analysis:
- Bollinger Bands (BB): The Bollinger Bands have been narrowing, suggesting decreasing volatility and a potential upcoming price breakout.
- BB Percentage (BBP): The BB Percentage has been relatively low, indicating a period of consolidation and potential price stability.
Volume Analysis:
- On-Balance Volume (OBV): The OBV has shown a slight increase, suggesting a moderate accumulation of the stock.
- Chaikin Money Flow (CMF): The CMF has been positive, indicating a net inflow of money into the stock.
Key Observations:
- The trend indicators show a potential bullish sentiment with the EMA trending upwards.
- Momentum indicators reflect a balanced market sentiment with no clear direction.
- Volatility indicators suggest a period of consolidation and decreasing volatility.
- Volume indicators indicate a moderate accumulation of the stock with positive money flow.
Conclusion:
Based on the analysis of the technical indicators, the stock price of SPXS is likely to experience sideways movement in the coming days. The bullish sentiment from the EMA and moderate accumulation indicated by volume indicators may support price stability. However, the lack of clear trend direction and balanced momentum signal caution. Traders should closely monitor key levels and wait for a clearer trend to emerge before making significant trading decisions.