Technical Analysis of SPXV 2024-05-10
Overview:
In the last 5 trading days, the SPXV stock has shown a consistent uptrend in its price movement. Various technical indicators across trend, momentum, volatility, and volume categories suggest positive momentum and strength in the stock. However, it is essential to delve deeper into each indicator to provide a comprehensive analysis and make an informed prediction for the next few days.
Trend Analysis:
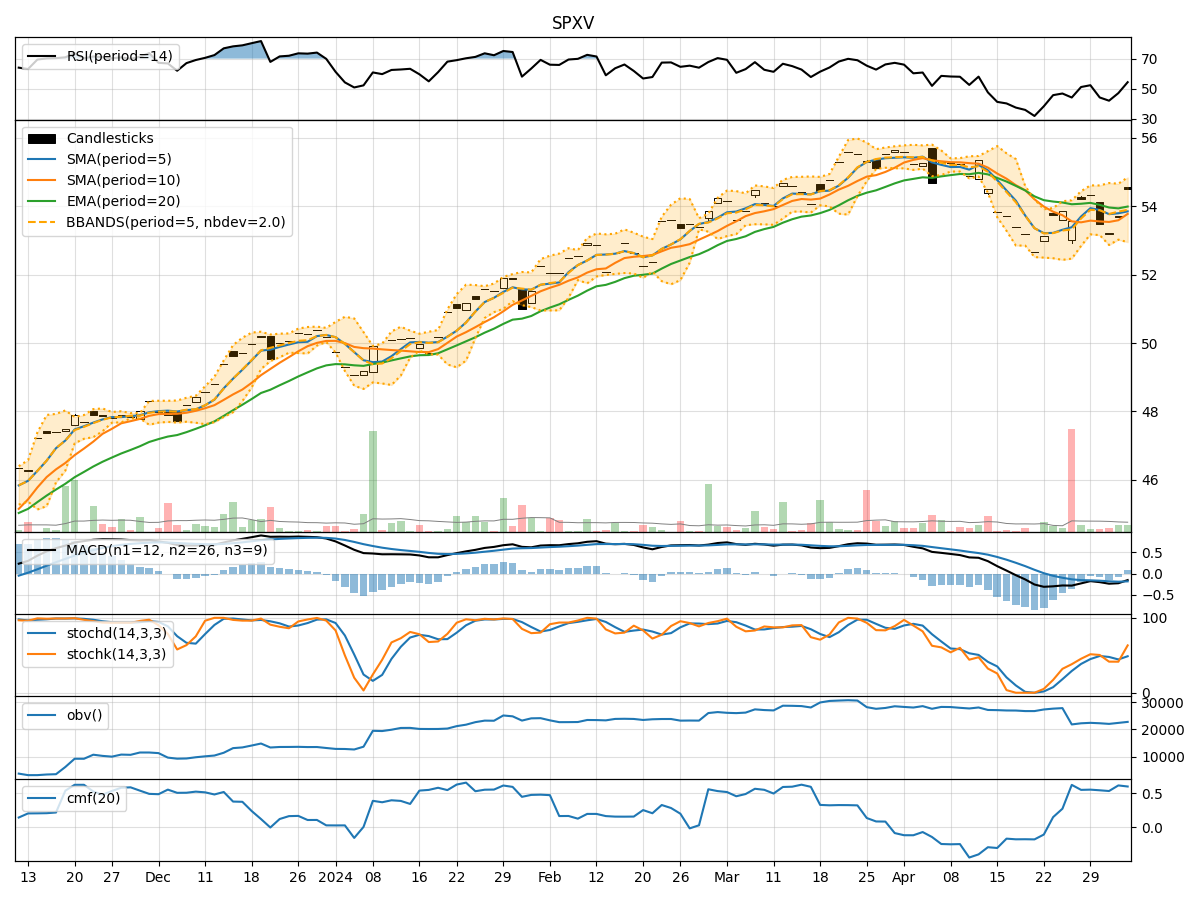
- Moving Averages (MA): The 5-day Moving Average (MA) has been consistently above the Simple Moving Average (SMA) and Exponential Moving Average (EMA), indicating a bullish trend.
- MACD: The MACD line has been consistently above the signal line, with both lines showing an upward trajectory, suggesting bullish momentum.
- Conclusion: The trend indicators point towards a strong bullish trend in the stock price.
Momentum Analysis:
- RSI: The Relative Strength Index (RSI) has been increasing steadily and is currently in the overbought territory, indicating strong buying momentum.
- Stochastic Oscillator: Both %K and %D lines are at 100%, signaling strong upward momentum.
- Conclusion: The momentum indicators suggest that the stock is overbought but still has strong bullish momentum.
Volatility Analysis:
- Bollinger Bands (BB): The stock price has been consistently trading above the middle Bollinger Band (BBM), indicating an uptrend with low volatility.
- Conclusion: The volatility indicators suggest that the stock is in a stable uptrend with low volatility.
Volume Analysis:
- On-Balance Volume (OBV): The OBV has been increasing steadily, indicating strong buying volume supporting the uptrend.
- Chaikin Money Flow (CMF): The CMF is positive and has been increasing, indicating strong buying pressure.
- Conclusion: The volume indicators suggest that there is strong buying volume supporting the current uptrend.
Overall Conclusion:
Based on the comprehensive analysis of the technical indicators, it is evident that the SPXV stock is currently in a strong bullish trend with positive momentum, low volatility, and strong buying volume. The stock is likely to continue its upward movement in the next few days. Therefore, the next few days' possible stock price movement for SPXV is upward. Investors may consider holding onto their positions or even consider adding to them based on the bullish outlook.
Key Takeaways:
- Bullish Trend: The stock is in a strong bullish trend supported by various technical indicators.
- Strong Momentum: The momentum indicators suggest strong buying momentum, albeit in the overbought territory.
- Low Volatility: The stock is experiencing low volatility, indicating a stable uptrend.
- Strong Volume: The buying volume is robust, supporting the current uptrend.
Disclaimer:
It is important to note that while technical analysis provides valuable insights, market dynamics can change rapidly. It is advisable to monitor the stock closely and consider other fundamental factors before making any investment decisions.