Technical Analysis of SPYC 2024-05-10
Overview:
In analyzing the technical indicators for SPYC over the last 5 days, we will delve into the trend, momentum, volatility, and volume indicators to provide a comprehensive outlook on the possible stock price movement in the coming days. By examining these key aspects, we aim to offer valuable insights and recommendations for potential investors.
Trend Indicators:
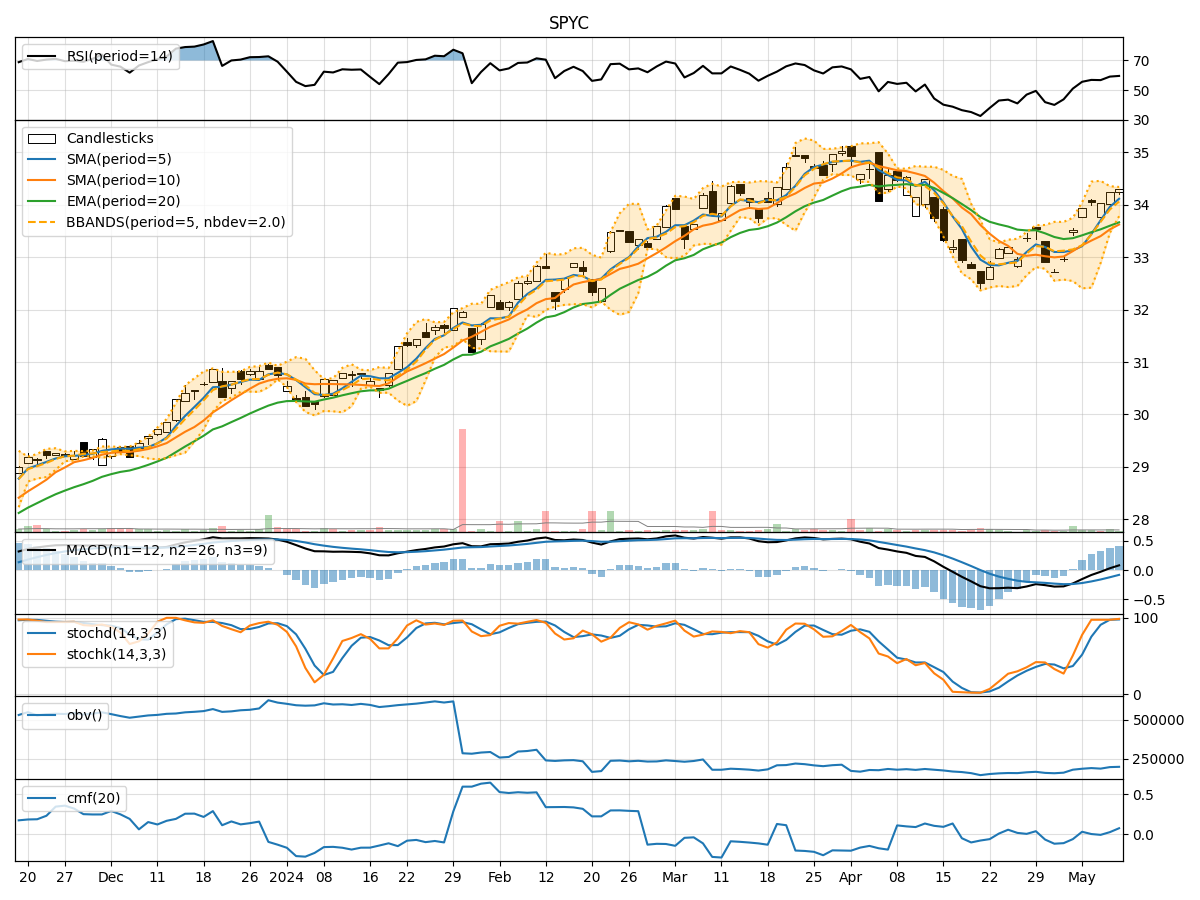
- Moving Averages (MA): The 5-day moving average has been consistently above the simple moving average (SMA) and exponential moving average (EMA), indicating a short-term uptrend.
- MACD: The MACD line has been positive, with the MACD histogram showing an increasing trend, suggesting bullish momentum.
- Conclusion: The trend indicators point towards an upward movement in the stock price.
Momentum Indicators:
- RSI: The Relative Strength Index (RSI) has been increasing, indicating strengthening momentum.
- Stochastic Oscillator: Both %K and %D have been in the overbought zone, suggesting a strong bullish momentum.
- Conclusion: Momentum indicators signal a bullish sentiment in the stock.
Volatility Indicators:
- Bollinger Bands (BB): The stock price has been trading within the upper Bollinger Band, indicating high volatility.
- Conclusion: Volatility indicators suggest a volatile price movement in the stock.
Volume Indicators:
- On-Balance Volume (OBV): The OBV has been fluctuating but generally showing a slight decrease, indicating some selling pressure.
- Chaikin Money Flow (CMF): The CMF has been positive, suggesting buying pressure.
- Conclusion: Volume indicators present a mixed signal with slight selling pressure but overall positive buying sentiment.
Conclusion:
Based on the analysis of trend, momentum, volatility, and volume indicators, the overall outlook for SPYC in the next few days appears to be bullish. The trend is upward, momentum is strong, and buying pressure is evident despite some volatility in the stock price. Investors may consider buying or holding positions in SPYC for potential gains in the near term.
Key Recommendations:
- Consider Long Positions: Given the bullish outlook, investors may look to enter long positions in SPYC.
- Monitor Volatility: Keep an eye on the volatility and adjust risk management strategies accordingly.
- Stay Informed: Continuously monitor the technical indicators for any changes that may impact trading decisions.
In conclusion, the technical analysis suggests a positive trajectory for SPYC, emphasizing a potential uptrend in the stock price. However, it is essential to combine technical analysis with fundamental research and risk management strategies for well-informed investment decisions.