Technical Analysis of SPYD 2024-05-10
Overview:
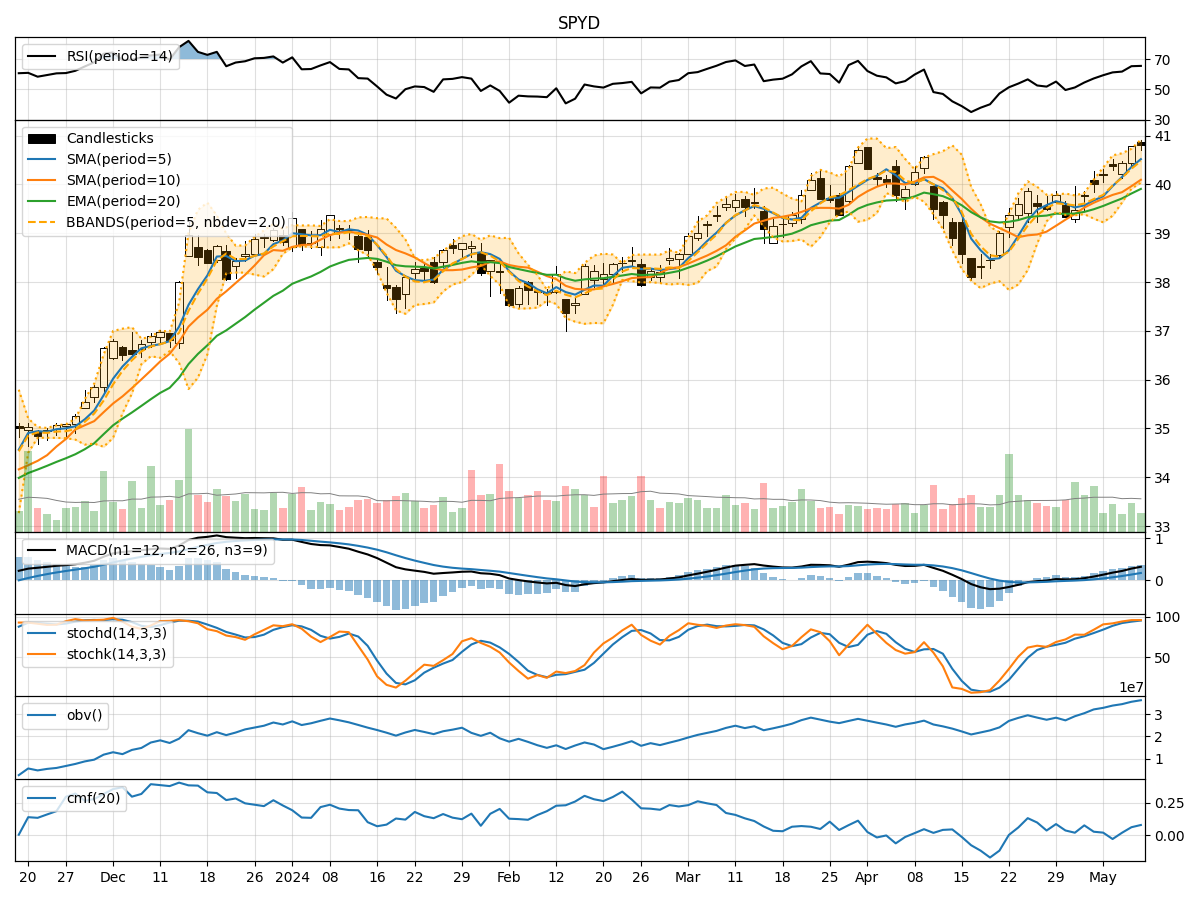
In analyzing the technical indicators for SPYD over the last 5 days, we will delve into the trend, momentum, volatility, and volume indicators to provide a comprehensive outlook on the possible stock price movement in the coming days. By examining these key indicators, we aim to offer valuable insights and predictions for informed decision-making.
Trend Indicators:
- Moving Averages (MA): The 5-day moving average has been consistently above the longer-term moving averages (SMA and EMA), indicating a short-term uptrend.
- MACD: The MACD line has been above the signal line, with both lines showing an increasing positive trend, suggesting bullish momentum.
- Conclusion: The trend indicators point towards an upward trend in the stock price.
Momentum Indicators:
- RSI: The RSI has been in the overbought territory, indicating strong buying momentum.
- Stochastic Oscillator: Both %K and %D have been in the overbought zone, suggesting a potential reversal.
- Williams %R: The indicator has been in the oversold region, signaling a possible buying opportunity.
- Conclusion: Momentum indicators are mixed, with a slight bearish bias due to overbought conditions.
Volatility Indicators:
- Bollinger Bands: The price has been trading within the bands, indicating normal volatility.
- Conclusion: Volatility remains stable, with no significant deviations from the bands, suggesting a sideways movement.
Volume Indicators:
- On-Balance Volume (OBV): The OBV has shown a consistent uptrend, indicating accumulation by investors.
- Chaikin Money Flow (CMF): The CMF has been positive, reflecting buying pressure.
- Conclusion: Volume indicators support the bullish sentiment, indicating strong buying interest.
Overall Conclusion:
Based on the analysis of trend, momentum, volatility, and volume indicators, the next few days' possible stock price movement for SPYD is likely to be upward with a bullish bias. The trend indicators suggest a continued uptrend, supported by positive volume indicators and stable volatility. However, caution is advised as momentum indicators show signs of potential reversal due to overbought conditions. Traders and investors should closely monitor price action and key support/resistance levels for confirmation of the anticipated upward movement.
Recommendation:
Considering the overall technical outlook and the potential for a bullish continuation, it may be opportune to consider long positions with appropriate risk management strategies in place. Traders should watch for any signs of divergence or weakening momentum to adjust their positions accordingly. Additionally, fundamental analysis should complement technical analysis to gain a holistic view of the stock's performance.