Technical Analysis of SPYG 2024-05-10
Overview:
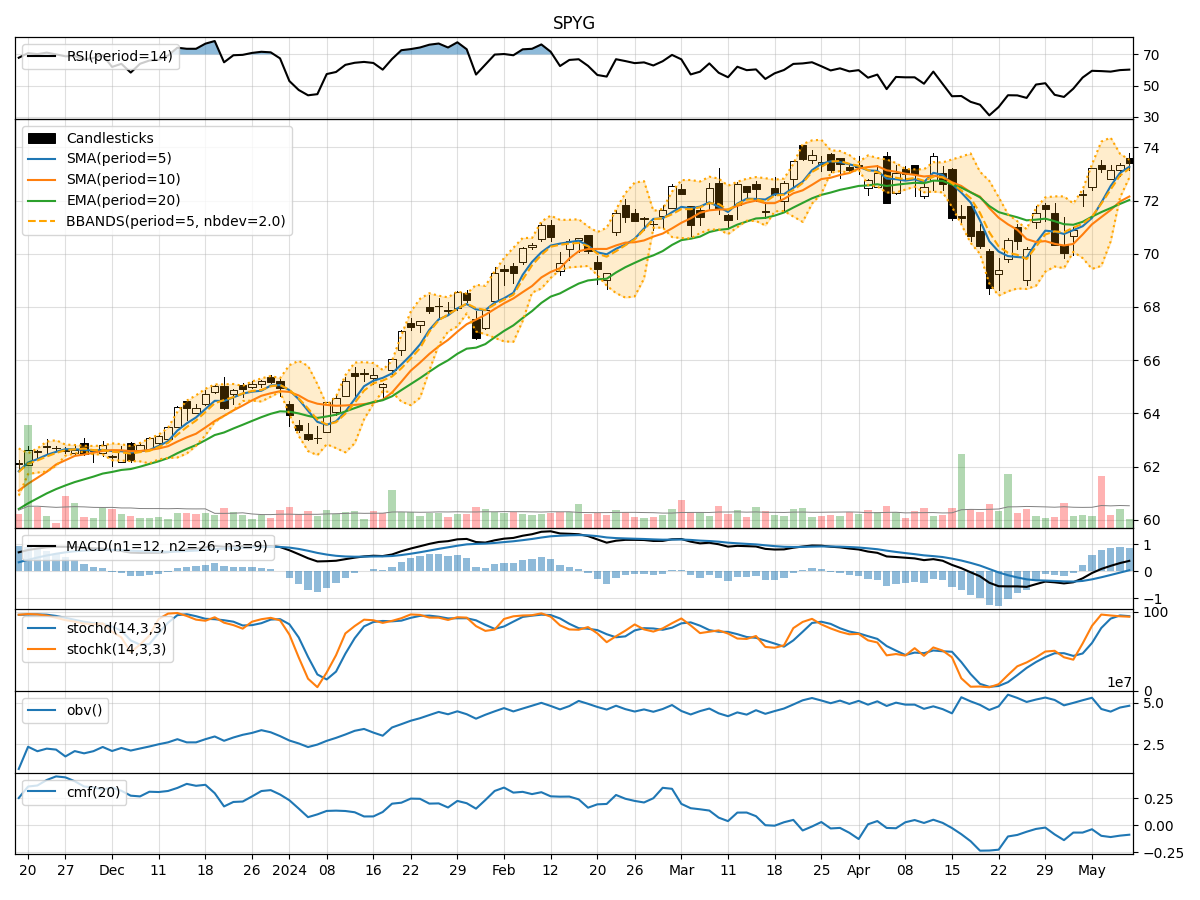
In analyzing the technical indicators for SPYG over the last 5 days, we will delve into the trend, momentum, volatility, and volume indicators to provide a comprehensive outlook on the possible stock price movement in the coming days. By examining these key indicators, we aim to offer valuable insights and predictions for informed decision-making.
Trend Analysis:
- Moving Averages (MA): The 5-day Moving Average has been consistently rising, indicating a bullish trend in the short term.
- MACD: The MACD line has been above the signal line, suggesting a positive momentum in the stock price.
- EMA: The Exponential Moving Average has been trending upwards, supporting the bullish sentiment.
Momentum Analysis:
- RSI: The Relative Strength Index has been increasing, showing strengthening buying momentum.
- Stochastic Oscillator: Both %K and %D have been relatively high, indicating an overbought condition.
- Williams %R: The indicator has been in the oversold territory, potentially signaling a reversal.
Volatility Analysis:
- Bollinger Bands: The stock price has been trading within the bands, indicating moderate volatility.
- Bollinger %B: The %B value has been fluctuating around 0.5, suggesting a balanced market sentiment.
Volume Analysis:
- On-Balance Volume (OBV): The OBV has shown mixed signals, reflecting indecision among market participants.
- Chaikin Money Flow (CMF): The CMF has been negative, indicating a bearish money flow trend.
Key Observations:
- The trend indicators suggest a bullish sentiment in the short term.
- Momentum indicators show a mix of overbought and oversold conditions, signaling potential price reversals.
- Volatility remains moderate, with the stock price trading within the Bollinger Bands.
- Volume indicators reflect indecision and a bearish money flow trend.
Conclusion:
Based on the analysis of the technical indicators, the stock price of SPYG is likely to experience further upward movement in the coming days. The bullish trend supported by moving averages and MACD, coupled with strengthening buying momentum indicated by RSI, suggests a positive outlook. However, caution is advised due to the overbought conditions highlighted by the Stochastic Oscillator and potential reversal signals from Williams %R. Overall, the stock is expected to continue its upward trajectory with some possible short-term corrections.