Technical Analysis of SPYI 2024-05-10
Overview:
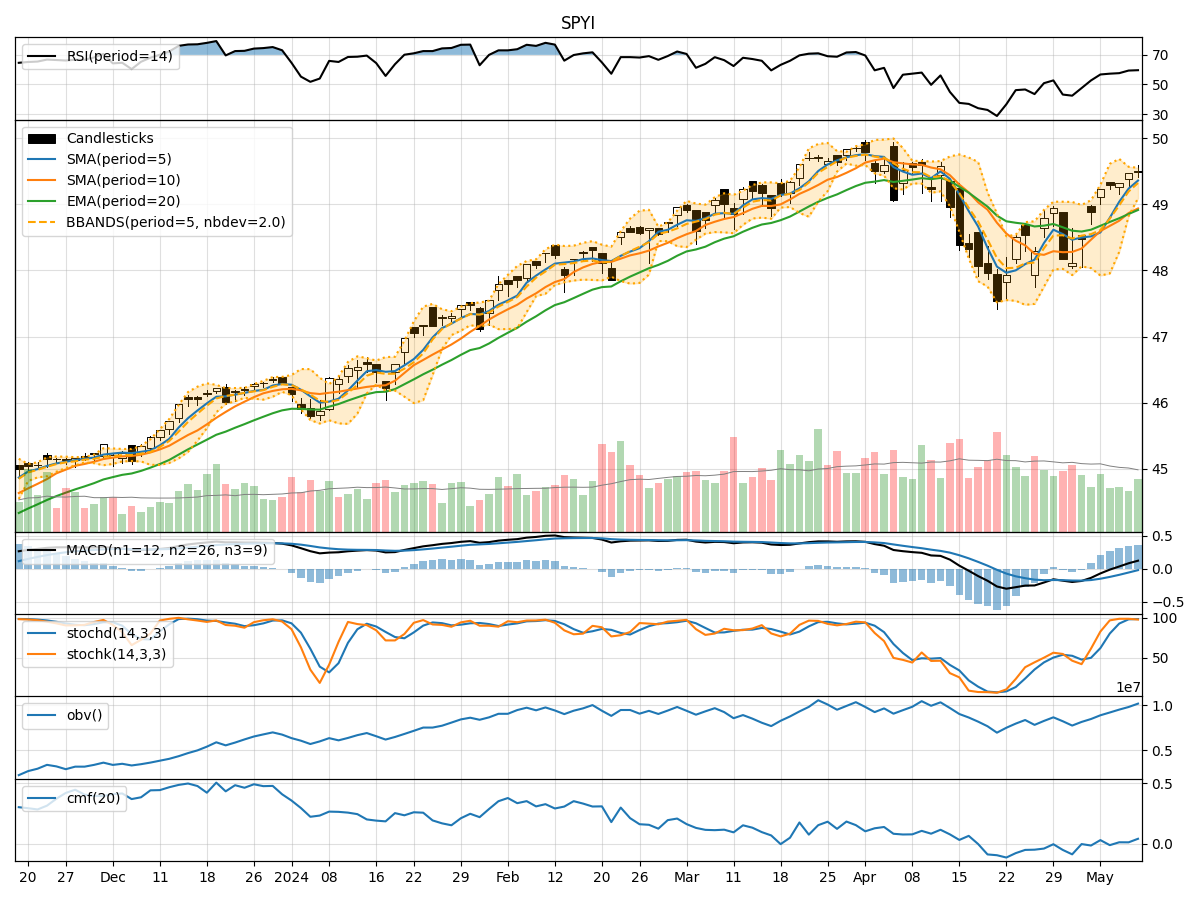
In analyzing the technical indicators for SPYI over the last 5 days, we will delve into the trends, momentum, volatility, and volume indicators to provide a comprehensive outlook on the possible stock price movement in the coming days.
Trend Indicators:
- Moving Averages (MA): The 5-day MA has been consistently rising, indicating a bullish trend.
- MACD: The MACD line has been above the signal line, suggesting a bullish momentum.
- EMA: The EMA has been trending upwards, supporting the bullish sentiment.
Momentum Indicators:
- RSI: The RSI has been in the overbought territory, indicating a strong bullish momentum.
- Stochastic Oscillator: Both %K and %D have been in the overbought zone, signaling a potential reversal.
- Williams %R: The indicator has been in the oversold region, suggesting a possible bullish reversal.
Volatility Indicators:
- Bollinger Bands (BB): The bands have been narrowing, indicating decreasing volatility.
- BB %B: The %B has been increasing, suggesting a potential breakout.
- BB Width: The width of the bands has been contracting, indicating a period of consolidation.
Volume Indicators:
- On-Balance Volume (OBV): The OBV has been mostly positive, indicating accumulation.
- Chaikin Money Flow (CMF): The CMF has been positive, reflecting buying pressure.
Key Observations:
- The trend indicators, momentum indicators, and volume indicators all point towards a bullish sentiment in the short term.
- The narrowing Bollinger Bands suggest a period of consolidation before a potential breakout.
- The overbought conditions in some momentum indicators may lead to a short-term pullback.
Conclusion:
Based on the analysis of the technical indicators, the next few days for SPYI are likely to see upward movement in the stock price. However, caution is advised as the overbought conditions in some momentum indicators may lead to a short-term correction before the bullish trend resumes. Traders should monitor the Bollinger Bands for a potential breakout and consider taking profits or setting stop-loss orders to manage risk effectively.