Technical Analysis of SPYX 2024-05-10
Overview:
In analyzing the technical indicators for SPYX over the last 5 days, we will delve into the trend, momentum, volatility, and volume indicators to provide a comprehensive outlook on the possible stock price movement in the coming days. By examining these key aspects, we aim to offer valuable insights and predictions to guide investment decisions.
Trend Analysis:
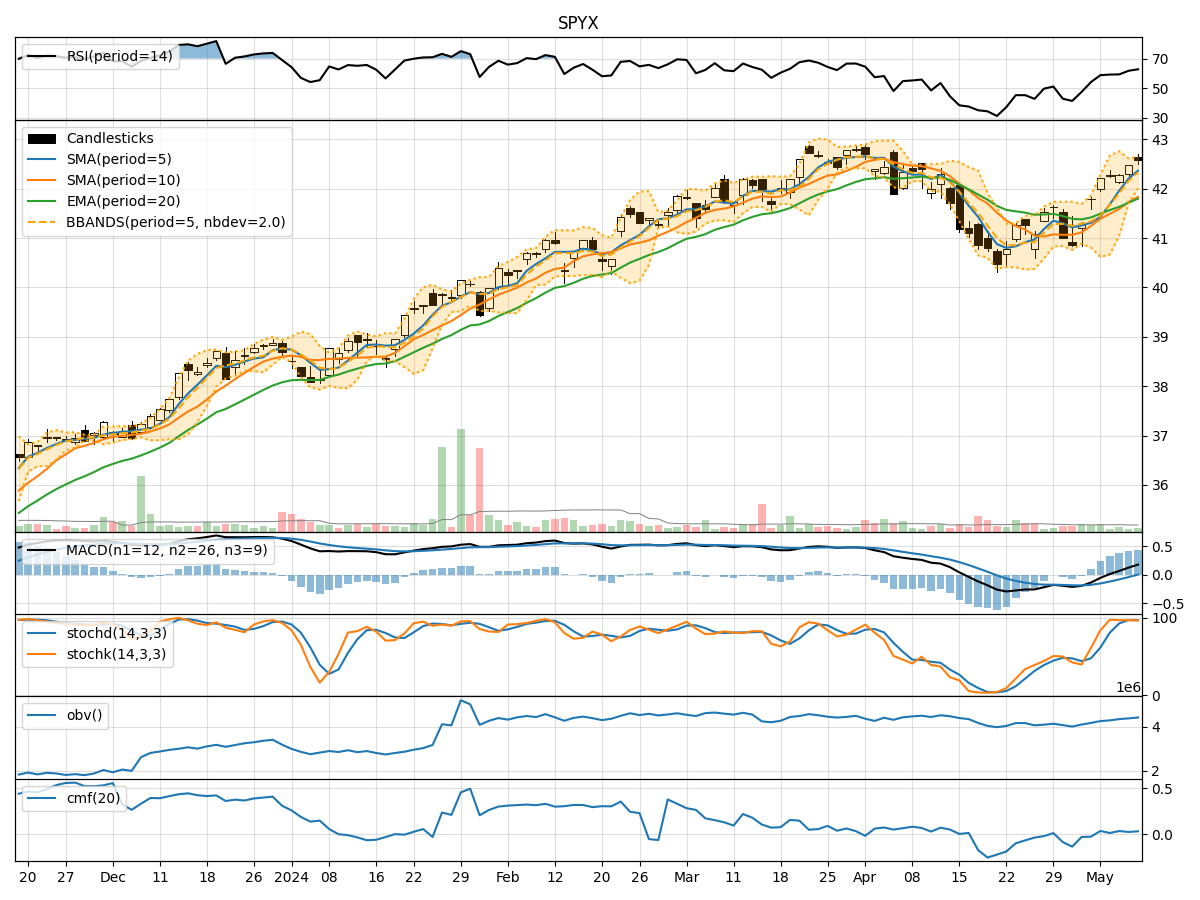
- Moving Averages (MA): The 5-day moving average has been consistently above the short-term (10-day) simple moving average, indicating a bullish trend.
- Exponential Moving Average (EMA): The EMA(20) has been trending upwards, reflecting a positive momentum in the stock price.
- MACD: The MACD line has been consistently above the signal line, suggesting a bullish trend.
Key Observation: The trend indicators point towards a bullish sentiment in the stock price movement.
Momentum Analysis:
- RSI (Relative Strength Index): RSI has been increasing and is currently in the overbought territory, indicating strong buying momentum.
- Stochastic Oscillator: Both %K and %D have been in the overbought zone, suggesting a potential reversal or consolidation.
- Williams %R (Willams %R): The indicator has been fluctuating around the oversold region, signaling potential buying opportunities.
Key Observation: Momentum indicators show a mixed signal with RSI indicating overbought conditions and stochastic oscillators hinting at a possible reversal.
Volatility Analysis:
- Bollinger Bands (BB): The stock price has been trading within the upper Bollinger Band, indicating increased volatility.
Key Observation: Volatility indicators suggest increased volatility in the stock price.
Volume Analysis:
- On-Balance Volume (OBV): The OBV has shown mixed signals with fluctuations in volume, indicating indecision among market participants.
- Chaikin Money Flow (CMF): The CMF has been positive, suggesting buying pressure in the stock.
Key Observation: Volume indicators reflect mixed signals with no clear trend in volume accumulation.
Conclusion:
Based on the analysis of trend, momentum, volatility, and volume indicators, the next few days' possible stock price movement for SPYX is likely to be upward in the short term. The bullish trend indicated by moving averages and MACD, coupled with strong buying momentum as seen in RSI, supports a positive outlook. However, the overbought conditions in momentum indicators and increased volatility signal caution, indicating a potential for a short-term pullback or consolidation.
Recommendation:
Considering the overall technical analysis, it is advisable to monitor the stock closely for any signs of reversal or consolidation. Investors may consider taking profits on any significant price spikes and setting stop-loss orders to manage risk effectively. Additionally, staying informed about market developments and news that could impact the stock price is crucial for making informed investment decisions.