Technical Analysis of SQLV 2024-05-10
Overview:
In analyzing the provided Technical Analysis (TA) data for SQLV stock over the last 5 days, we will delve into the trend, momentum, volatility, and volume indicators to forecast the possible stock price movement in the upcoming days. By examining these key indicators, we aim to provide a comprehensive and insightful prediction for SQLV stock.
Trend Analysis:
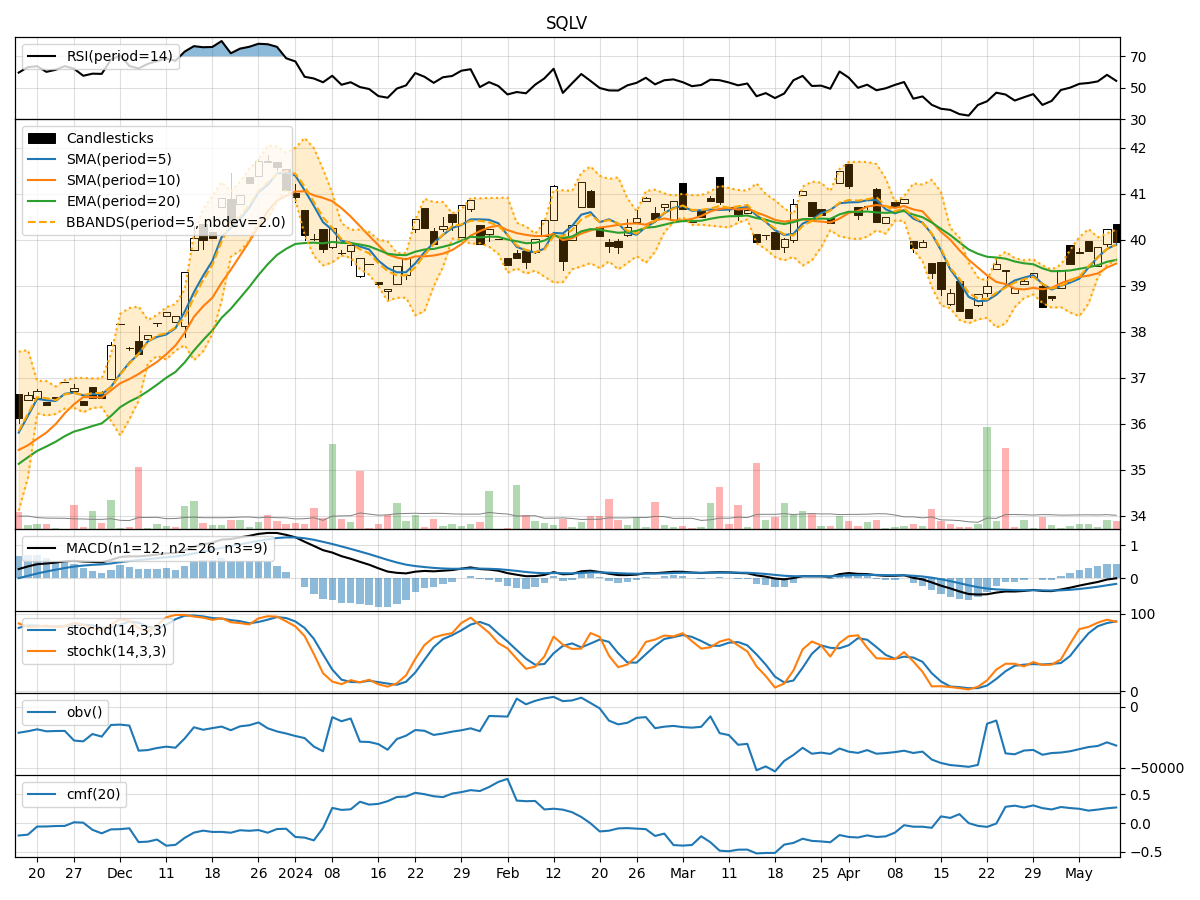
- Moving Averages (MA): The 5-day Moving Average (MA) has been consistently above the closing prices, indicating a potential bullish trend.
- MACD: The Moving Average Convergence Divergence (MACD) has been negative but showing signs of convergence towards the signal line, suggesting a possible trend reversal.
- RSI: The Relative Strength Index (RSI) has been fluctuating around the neutral zone, indicating a lack of strong trend direction.
Momentum Analysis:
- Stochastic Oscillator: The Stochastic Oscillator is in the overbought region, suggesting a potential reversal or consolidation in the stock price.
- Williams %R: The Williams %R is in the oversold territory, indicating a possible buying opportunity in the near term.
Volatility Analysis:
- Bollinger Bands: The Bollinger Bands are narrowing, indicating decreasing volatility and a potential breakout or significant price movement ahead.
- Average True Range (ATR): The ATR is relatively stable, suggesting a consistent level of price volatility in the stock.
Volume Analysis:
- On-Balance Volume (OBV): The OBV has been fluctuating, indicating mixed buying and selling pressure in the stock.
- Chaikin Money Flow (CMF): The CMF is positive, suggesting that money is flowing into the stock over the 20-day period.
Key Observations:
- The trend indicators show a potential bullish bias with signs of a trend reversal.
- Momentum indicators suggest a mixed outlook with conflicting signals from the Stochastic Oscillator and Williams %R.
- Volatility indicators point towards a potential breakout or significant price movement.
- Volume indicators indicate mixed buying and selling pressure with a positive money flow into the stock.
Conclusion:
Based on the analysis of the technical indicators, the next few days for SQLV stock could see increased volatility and a potential bullish trend continuation. Traders should closely monitor the narrowing Bollinger Bands for a potential breakout and consider the mixed signals from the momentum indicators. Overall, the stock is likely to experience upward price movement in the near term.