Technical Analysis of SRHQ 2024-05-10
Overview:
In analyzing the technical indicators for SRHQ stock over the last 5 days, we will delve into the trends, momentum, volatility, and volume aspects to provide a comprehensive outlook on the possible stock price movement in the upcoming days. By examining key indicators such as moving averages, MACD, RSI, Bollinger Bands, and OBV, we aim to offer valuable insights and predictions for informed decision-making.
Trend Analysis:
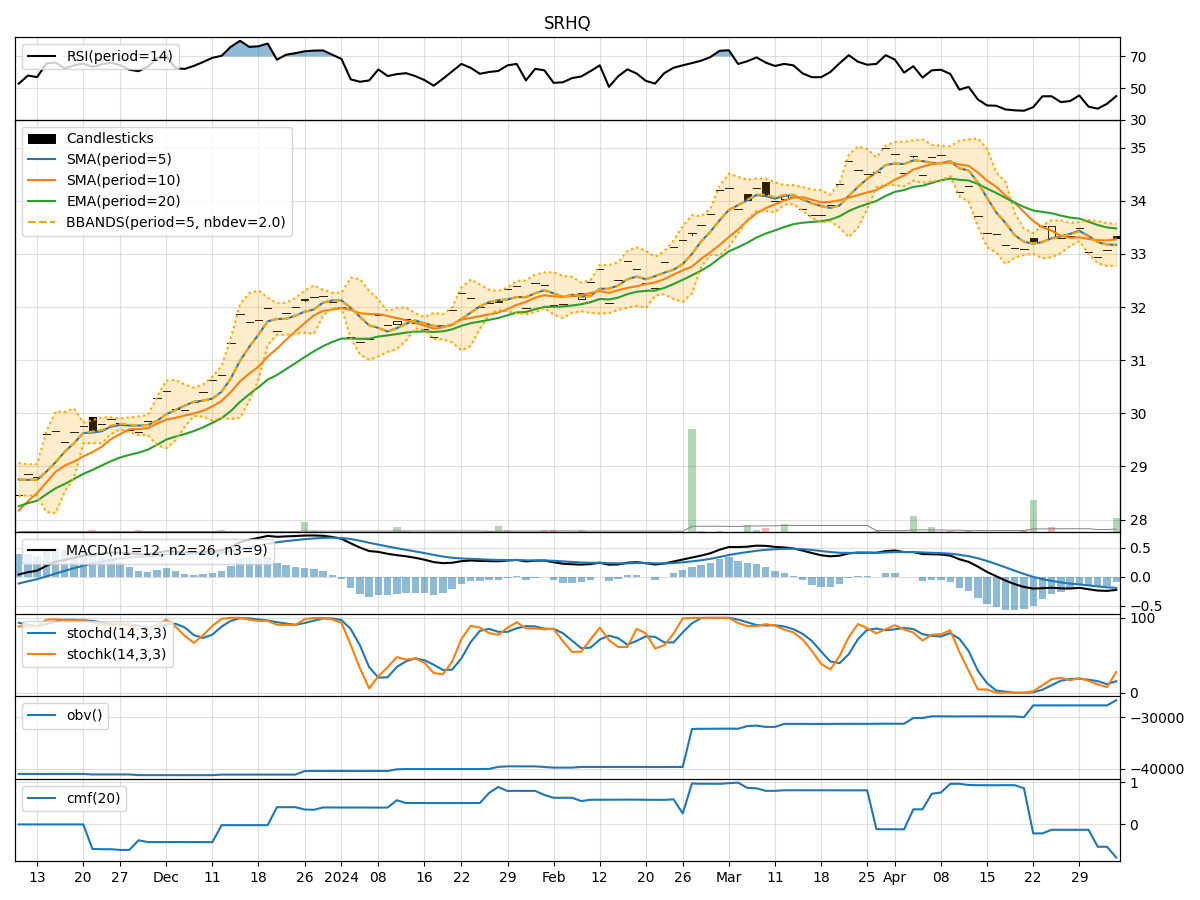
- Moving Averages (MA): The 5-day MA has been consistently above the closing prices, indicating a short-term uptrend.
- MACD: The MACD line has been negative but trending towards the signal line, suggesting a potential reversal in the short term.
Key Observation: The stock is currently in a short-term uptrend, with signs of a possible reversal in the near future.
Momentum Analysis:
- RSI: The RSI values have been fluctuating around the 50 level, indicating a balanced momentum without extreme overbought or oversold conditions.
- Stochastic Oscillator: Both %K and %D values have been high, suggesting strong momentum in the recent trading days.
Key Observation: Momentum is relatively stable, with no clear indication of a significant shift in either direction.
Volatility Analysis:
- Bollinger Bands (BB): The stock price has been trading within the bands, with the bands narrowing over the last few days, indicating decreasing volatility.
Key Observation: Volatility is decreasing, potentially leading to a period of consolidation or a breakout in the near future.
Volume Analysis:
- On-Balance Volume (OBV): The OBV values have been fluctuating around a similar level, indicating a balance between buying and selling pressure.
Key Observation: Volume has been relatively stable, suggesting a lack of significant accumulation or distribution.
Conclusion:
Based on the analysis of the technical indicators, the next few days for SRHQ stock are likely to see sideways movement with a potential for a breakout. The stock is currently in a short-term uptrend, supported by stable momentum and decreasing volatility. However, the lack of significant volume activity may lead to a period of consolidation before a potential price movement.
Recommendation: Consider monitoring the stock closely for any signs of a breakout above the current trading range. Traders may look for entry points near key support levels for potential upside gains. Investors should exercise caution and wait for a clearer trend confirmation before making significant decisions.
In summary, the outlook for SRHQ stock in the next few days leans towards sideways consolidation with a bullish bias for a potential breakout.