Technical Analysis of SRHR 2024-05-10
Overview:
In analyzing the technical indicators for SRHR stock over the last 5 days, we will delve into the trend, momentum, volatility, and volume indicators to provide a comprehensive outlook on the possible stock price movement in the coming days. By examining these key indicators, we aim to offer valuable insights and predictions for potential investors.
Trend Analysis:
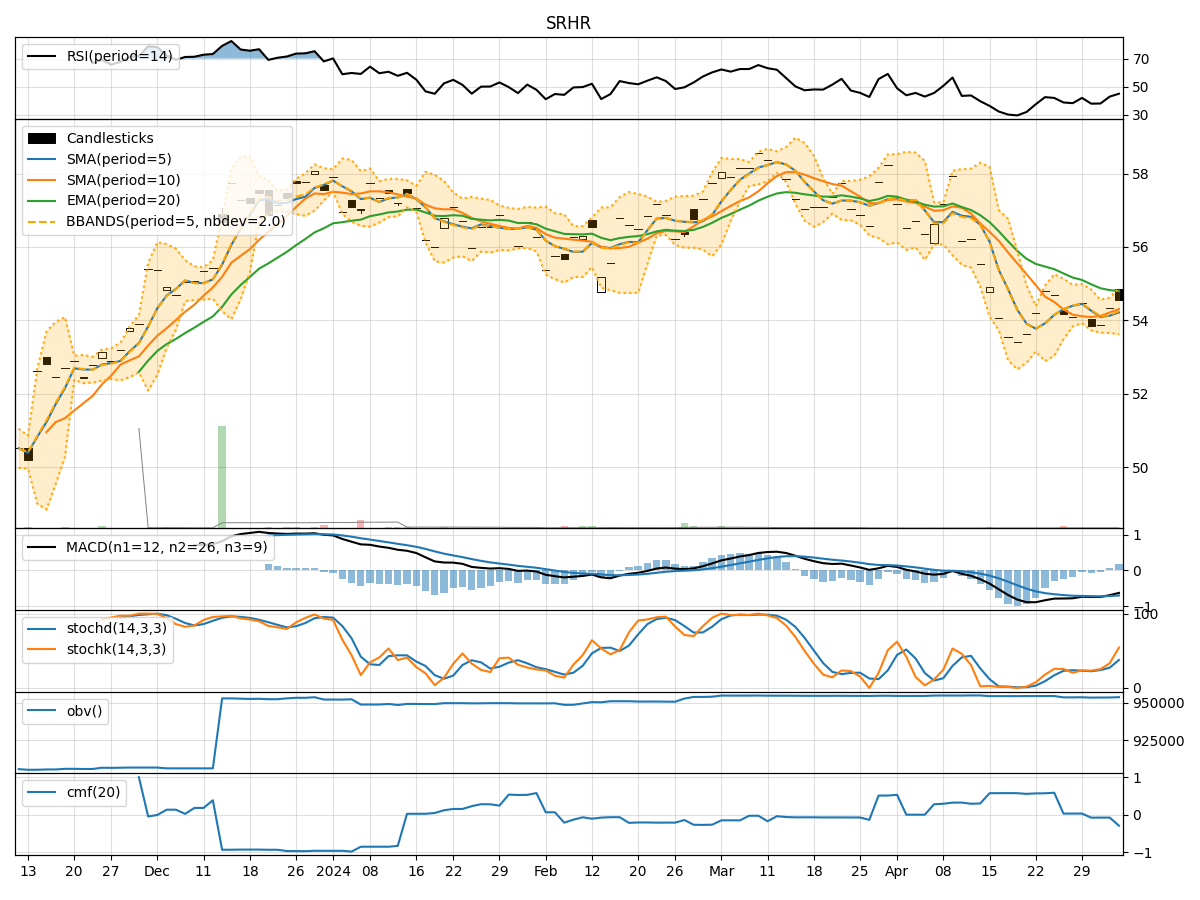
- Moving Averages (MA): The 5-day Moving Average (MA) has been showing an upward trend, indicating a positive momentum in the stock price.
- MACD: The Moving Average Convergence Divergence (MACD) has been consistently negative, suggesting a bearish trend in the stock.
- EMA: The Exponential Moving Average (EMA) has been relatively stable, indicating a potential consolidation phase in the stock price.
Momentum Analysis:
- RSI: The Relative Strength Index (RSI) has been fluctuating around the neutral zone, indicating a lack of strong momentum in either direction.
- Stochastic Oscillator: The Stochastic Oscillator has been hovering in the overbought territory, suggesting a potential reversal in the stock price.
- Williams %R: The Williams %R indicator has been oscillating near the oversold region, signaling a possible buying opportunity.
Volatility Analysis:
- Bollinger Bands: The Bollinger Bands have been widening, indicating increased volatility in the stock price.
- Volatility Bands: The Volatility Bands have shown an expansion, suggesting potential price swings in the coming days.
Volume Analysis:
- On-Balance Volume (OBV): The OBV indicator has been relatively stable, indicating a balance between buying and selling pressure.
- Chaikin Money Flow (CMF): The CMF has been negative, suggesting a bearish sentiment in the stock.
Conclusion:
Based on the analysis of the technical indicators, the stock price of SRHR is likely to experience sideways movement in the next few days. The bearish trend indicated by the MACD and the lack of strong momentum shown by the RSI suggest a period of consolidation. The volatility expansion indicated by the Bollinger Bands may lead to price swings, but the overall sentiment remains neutral. Traders should exercise caution and wait for clearer signals before making significant trading decisions.