Technical Analysis of SRVR 2024-05-10
Overview:
In analyzing the technical indicators for SRVR stock over the last 5 days, we will delve into the trend, momentum, volatility, and volume indicators to provide a comprehensive outlook on the possible future stock price movement. By examining these key indicators, we aim to offer valuable insights and predictions for the upcoming trading days.
Trend Analysis:
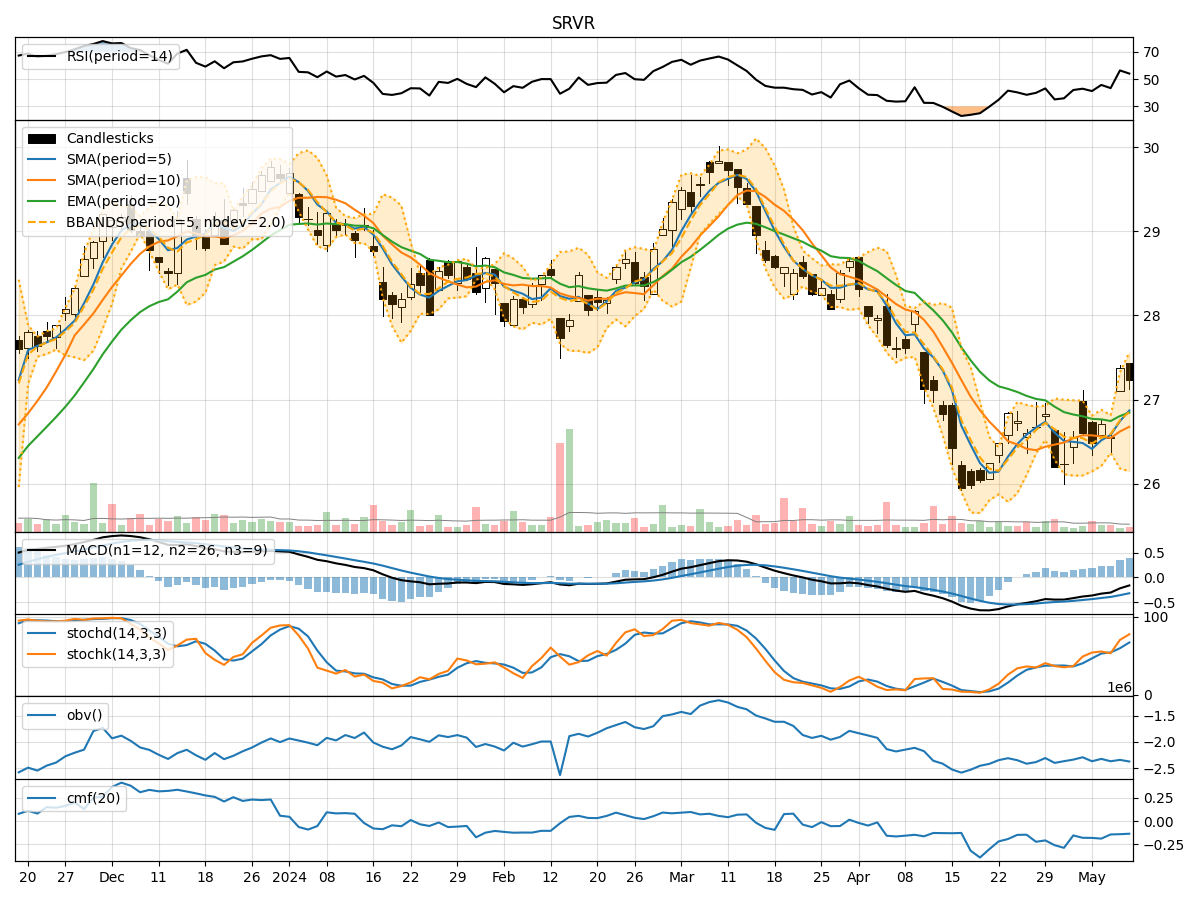
- Moving Averages (MA): The 5-day Moving Average (MA) has been fluctuating around the closing prices, indicating a short-term trend. The Simple Moving Average (SMA) and Exponential Moving Average (EMA) show a slight downward trend, with the EMA lagging behind.
- MACD: The Moving Average Convergence Divergence (MACD) has been negative, suggesting a bearish momentum in the stock price.
- Conclusion: The trend indicators point towards a downward trend in the stock price.
Momentum Analysis:
- RSI: The Relative Strength Index (RSI) has been oscillating around the mid-level, indicating a neutral momentum in the stock.
- Stochastic Oscillator: Both %K and %D have been in the overbought zone, suggesting a potential reversal in the momentum.
- Conclusion: The momentum indicators signal a neutral to bearish sentiment in the stock.
Volatility Analysis:
- Bollinger Bands: The Bollinger Bands have widened, indicating increased volatility in the stock price.
- Conclusion: The volatility indicators suggest a high volatility environment for the stock.
Volume Analysis:
- On-Balance Volume (OBV): The OBV has been negative, indicating selling pressure in the stock.
- Chaikin Money Flow (CMF): The CMF has been negative, reflecting a lack of buying interest.
- Conclusion: The volume indicators point towards bearish sentiment in the stock.
Overall Conclusion:
Based on the analysis of trend, momentum, volatility, and volume indicators, the overall outlook for SRVR stock in the next few days is bearish. The trend indicators show a downward trajectory, supported by negative momentum and volume indicators. The high volatility in the stock further adds to the bearish sentiment. Therefore, it is likely that the stock price may experience a downward movement in the upcoming trading sessions.
Key Recommendations:
- Caution in Trading: Traders should exercise caution and consider short-selling or staying on the sidelines until a clear trend reversal is observed.
- Monitor Key Levels: Keep a close eye on key support levels to gauge potential entry or exit points.
- Diversification: Consider diversifying your portfolio to mitigate risks associated with individual stock movements.
By carefully monitoring these indicators and staying informed about market developments, investors can make well-informed decisions aligned with the prevailing market sentiment.