Technical Analysis of SSFI 2024-05-10
Overview:
In analyzing the technical indicators for SSFI over the last 5 days, we will delve into the trend, momentum, volatility, and volume indicators to provide a comprehensive outlook on the possible stock price movement in the coming days. By examining these key aspects, we aim to offer valuable insights and predictions to guide your investment decisions.
Trend Analysis:
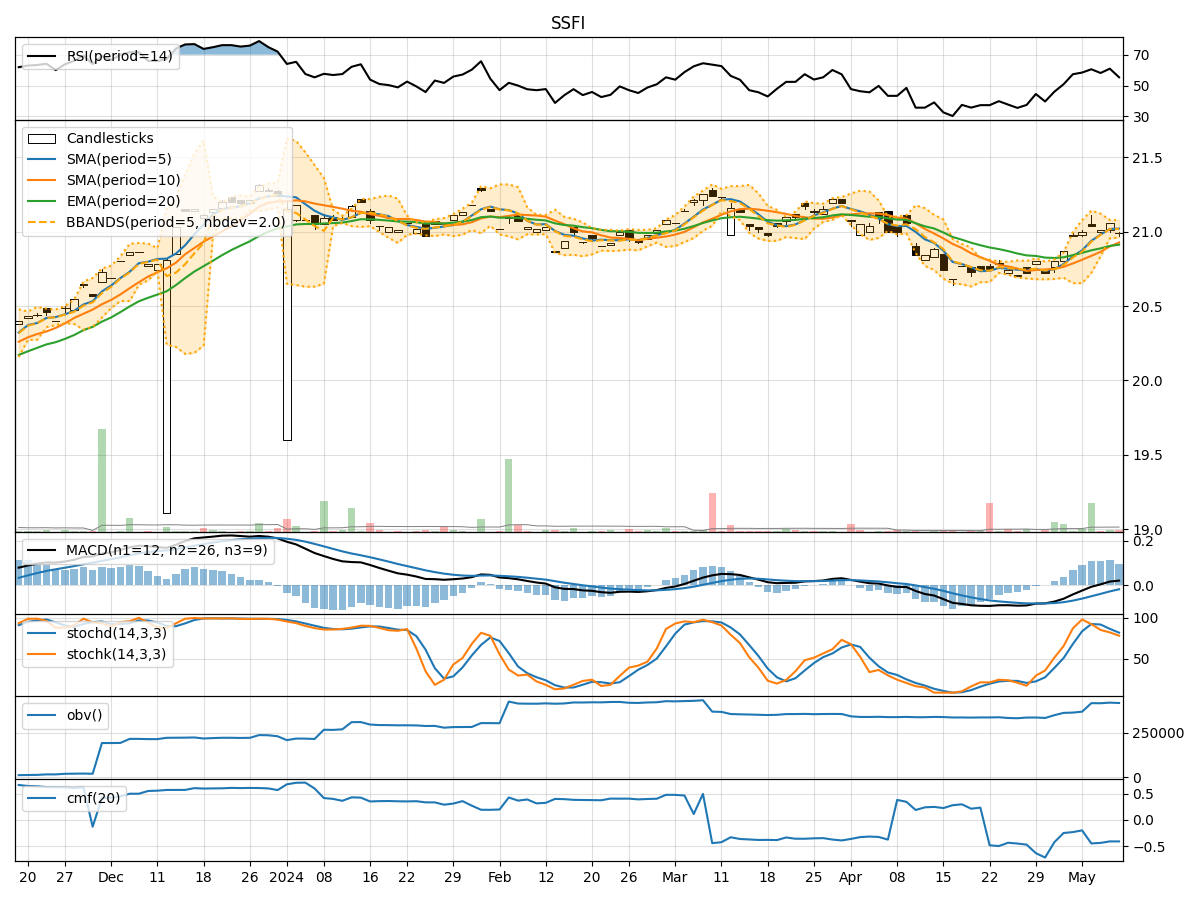
- Moving Averages (MA): The 5-day Moving Average (MA) has been consistently above the Simple Moving Average (SMA) and Exponential Moving Average (EMA), indicating a bullish trend.
- MACD: The MACD line has been consistently above the signal line, suggesting a bullish momentum in the stock price.
Momentum Analysis:
- RSI: The Relative Strength Index (RSI) has been fluctuating around the 60-65 range, indicating a neutral momentum in the stock.
- Stochastic Oscillator: Both %K and %D have been gradually decreasing, signaling a potential bearish momentum.
Volatility Analysis:
- Bollinger Bands (BB): The stock price has been trading within the Bollinger Bands, with the bands narrowing, indicating decreasing volatility.
Volume Analysis:
- On-Balance Volume (OBV): The OBV has shown mixed signals with fluctuations, suggesting indecision among investors.
- Chaikin Money Flow (CMF): The CMF has been consistently negative, indicating selling pressure in the stock.
Key Observations:
- The trend indicators suggest a bullish sentiment in the stock price.
- Momentum indicators show a neutral to slightly bearish momentum.
- Volatility has been decreasing, indicating a potential consolidation phase.
- Volume indicators reflect mixed signals with selling pressure.
Conclusion:
Based on the analysis of the technical indicators, the next few days' possible stock price movement for SSFI is likely to be sideways with a slight bearish bias. Investors should exercise caution and closely monitor the price action for any potential trend reversal signals. It is advisable to wait for more clarity in the market dynamics before making significant trading decisions.