Technical Analysis of SSG 2024-05-10
Overview:
In analyzing the technical indicators for the last 5 days of SSG stock, we will delve into the trend, momentum, volatility, and volume indicators to provide a comprehensive outlook on the possible stock price movement in the coming days. By examining these key indicators, we aim to offer valuable insights and predictions to guide investment decisions.
Trend Analysis:
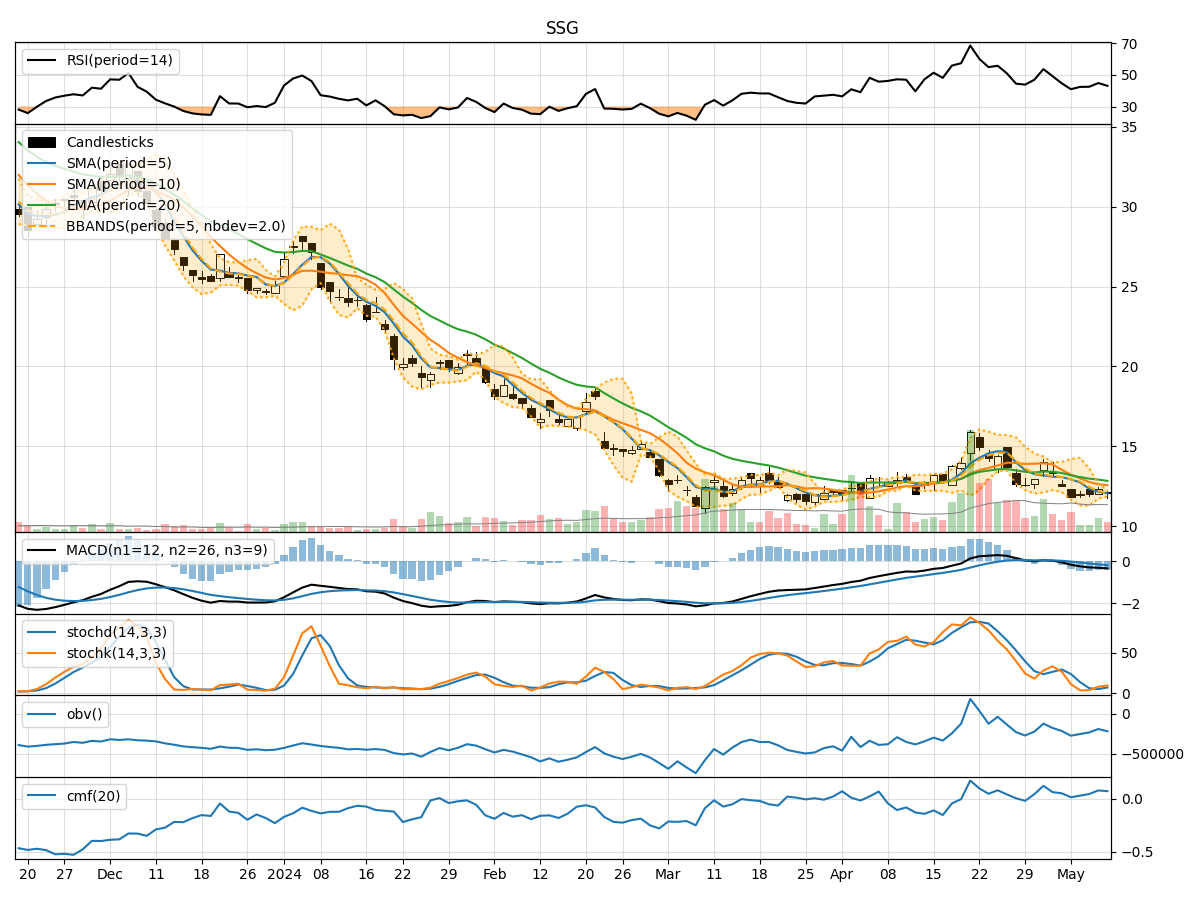
- Moving Averages (MA): The 5-day MA has been consistently below the SMA(10) and EMA(20), indicating a downward trend in the stock price.
- MACD: The MACD line has been decreasing, with the MACD line consistently below the signal line, suggesting a bearish momentum in the stock.
- Conclusion: The trend indicators point towards a downward movement in the stock price.
Momentum Analysis:
- RSI: The RSI has been fluctuating around the mid-level, indicating a lack of strong momentum in either direction.
- Stochastic Oscillator: Both %K and %D have been relatively low, suggesting a lack of strong buying or selling pressure.
- Conclusion: The momentum indicators suggest a sideways movement in the stock price.
Volatility Analysis:
- Bollinger Bands (BB): The stock price has been trading within the lower Bollinger Band, indicating lower volatility.
- Conclusion: The volatility indicators suggest a low volatility environment for the stock.
Volume Analysis:
- On-Balance Volume (OBV): The OBV has been increasing over the last 5 days, indicating a higher volume on up days compared to down days.
- Chaikin Money Flow (CMF): The CMF has been positive, suggesting buying pressure in the stock.
- Conclusion: The volume indicators point towards a bullish sentiment in the stock.
Overall Conclusion:
Based on the analysis of the trend, momentum, volatility, and volume indicators, the next few days' possible stock price movement for SSG is as follows: - Trend: The trend indicators suggest a downward movement. - Momentum: The momentum indicators indicate a sideways movement. - Volatility: The volatility indicators point towards low volatility. - Volume: The volume indicators suggest a bullish sentiment.
Final Recommendation:
Considering the mixed signals from the different indicators, it is crucial to proceed with caution. While the trend and momentum indicators lean towards a downward or sideways movement, the bullish sentiment in volume indicators could potentially support a short-term uptick in the stock price. Investors should closely monitor the stock for any shifts in the indicators and market conditions before making any trading decisions.