Technical Analysis of SSLY 2024-05-10
Overview:
In analyzing the technical indicators for SSLY stock over the last 5 days, we will delve into the trend, momentum, volatility, and volume indicators to provide a comprehensive outlook on the possible stock price movement in the coming days. By examining key metrics such as moving averages, MACD, RSI, Bollinger Bands, and OBV, we aim to offer valuable insights and predictions for potential price action.
Trend Indicators:
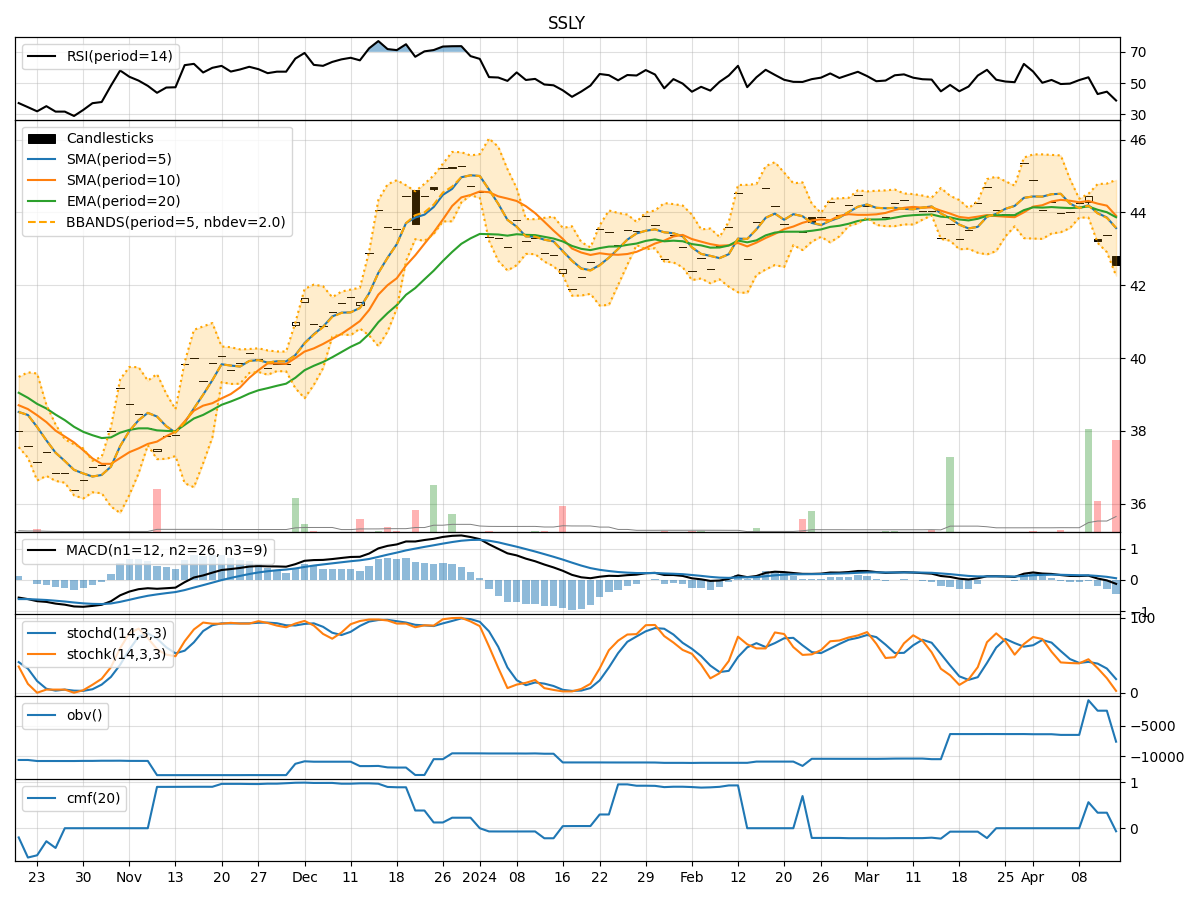
- Moving Averages (MA): The 5-day MA has been consistently above the closing prices, indicating a bullish trend.
- MACD: The MACD line has been trending upwards, with the MACD histogram showing positive values, suggesting bullish momentum.
- EMA: The EMA has been steadily increasing, supporting the bullish sentiment in the short term.
Momentum Indicators:
- RSI: The RSI has been fluctuating around the overbought territory, indicating strong buying pressure.
- Stochastic Oscillator: Both %K and %D have been relatively high, signaling potential overbought conditions.
- Williams %R: The indicator has been in the oversold region, suggesting a possible reversal in the short term.
Volatility Indicators:
- Bollinger Bands: The price has been trading within the bands, indicating normal volatility.
- Bollinger %B: The %B value has been fluctuating around the midline, suggesting a balanced market sentiment.
Volume Indicators:
- On-Balance Volume (OBV): The OBV has been relatively flat, indicating a lack of significant volume accumulation.
- Chaikin Money Flow (CMF): The CMF has been negative, reflecting selling pressure in the market.
Key Observations:
- The trend indicators point towards a bullish sentiment, supported by the moving averages and MACD.
- Momentum indicators show mixed signals, with RSI indicating strength but stochastic oscillators suggesting potential overbought conditions.
- Volatility remains relatively stable, with Bollinger Bands not showing extreme fluctuations.
- Volume indicators indicate a lack of significant accumulation, with OBV and CMF reflecting neutral to bearish sentiment.
Conclusion:
Based on the analysis of the technical indicators, the next few days for SSLY stock are likely to see upward price movement, supported by the bullish trend indicators. However, caution is advised due to potential overbought conditions highlighted by momentum indicators. Traders should closely monitor price action and volume dynamics for confirmation of the bullish trend. Overall, a cautiously bullish view is recommended for the upcoming days.