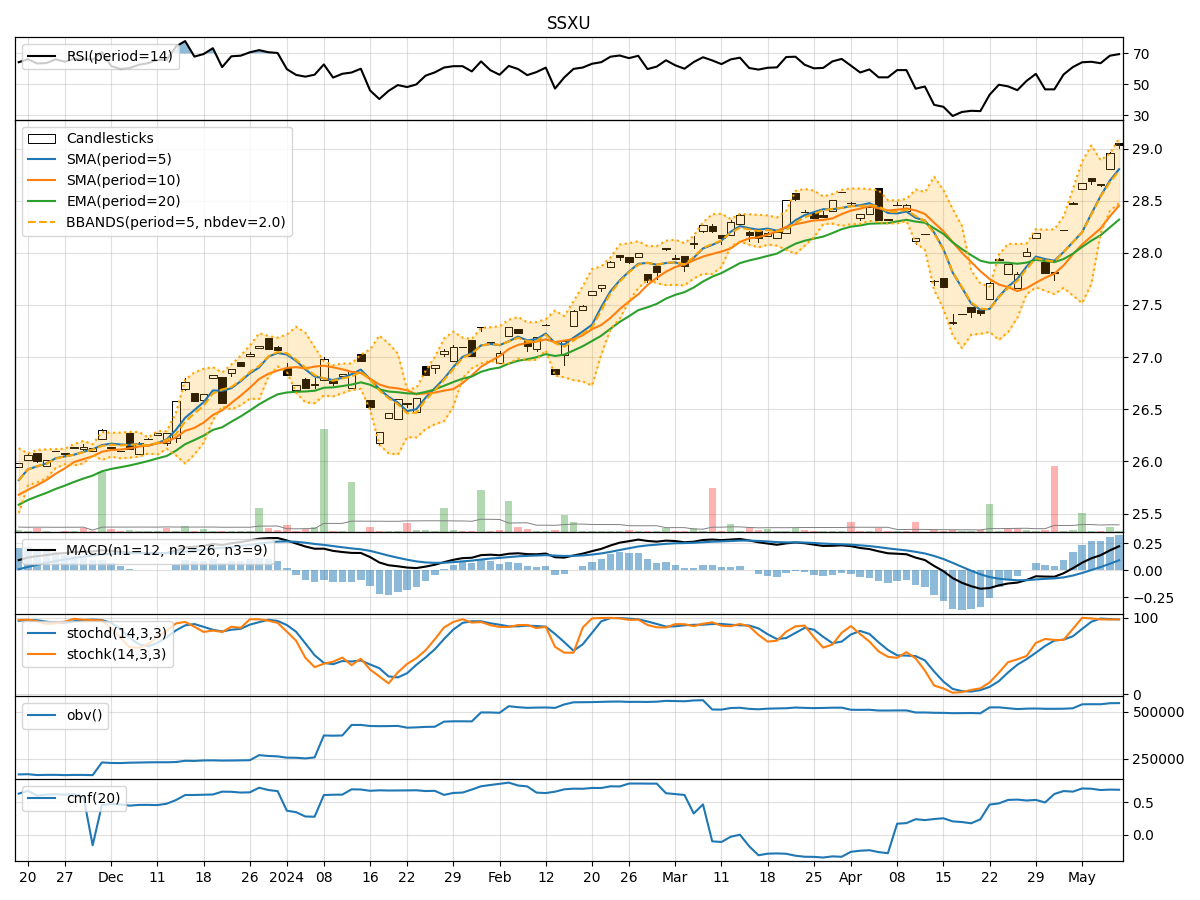
Technical Analysis of SSXU 2024-05-10
Overview:
In analyzing the technical indicators for SSXU over the last 5 days, we will delve into the trend, momentum, volatility, and volume indicators to provide a comprehensive outlook on the possible stock price movement in the coming days.
Trend Analysis:
- Moving Averages (MA): The 5-day MA has been consistently above the closing prices, indicating a bullish trend.
- MACD: The MACD line has been above the signal line, suggesting a bullish momentum.
- EMA: The EMA has been trending upwards, supporting the bullish sentiment.
Momentum Analysis:
- RSI: The RSI has been in the overbought territory, indicating a strong bullish momentum.
- Stochastic Oscillator: Both %K and %D have been high, signaling an overbought condition.
- Williams %R: The indicator has been consistently in the oversold region, reflecting strong buying pressure.
Volatility Analysis:
- Bollinger Bands (BB): The stock price has been trading within the bands, showing moderate volatility.
- BB Width: The bands have been relatively narrow, suggesting a period of consolidation.
- BB %B: The %B indicator has been fluctuating around the midline, indicating a balanced market sentiment.
Volume Analysis:
- On-Balance Volume (OBV): The OBV has been increasing, indicating accumulation by investors.
- Chaikin Money Flow (CMF): The CMF has been positive, reflecting buying pressure in the stock.
Key Observations:
- The trend indicators suggest a strong bullish sentiment with moving averages and MACD supporting an upward trajectory.
- Momentum indicators indicate an overbought condition, potentially signaling a short-term pullback.
- Volatility remains moderate with Bollinger Bands indicating a period of consolidation.
- Volume indicators show accumulation and positive money flow, supporting the bullish bias.
Conclusion:
Based on the analysis of technical indicators, the stock is likely to experience a short-term pullback or consolidation due to the overbought momentum and moderate volatility. However, the overall trend remains bullish, supported by moving averages and positive volume indicators. Traders may consider taking profits or waiting for a better entry point during the anticipated pullback. Long-term investors can hold their positions as the underlying bullish trend is intact.