Technical Analysis of STAX 2024-05-10
Overview:
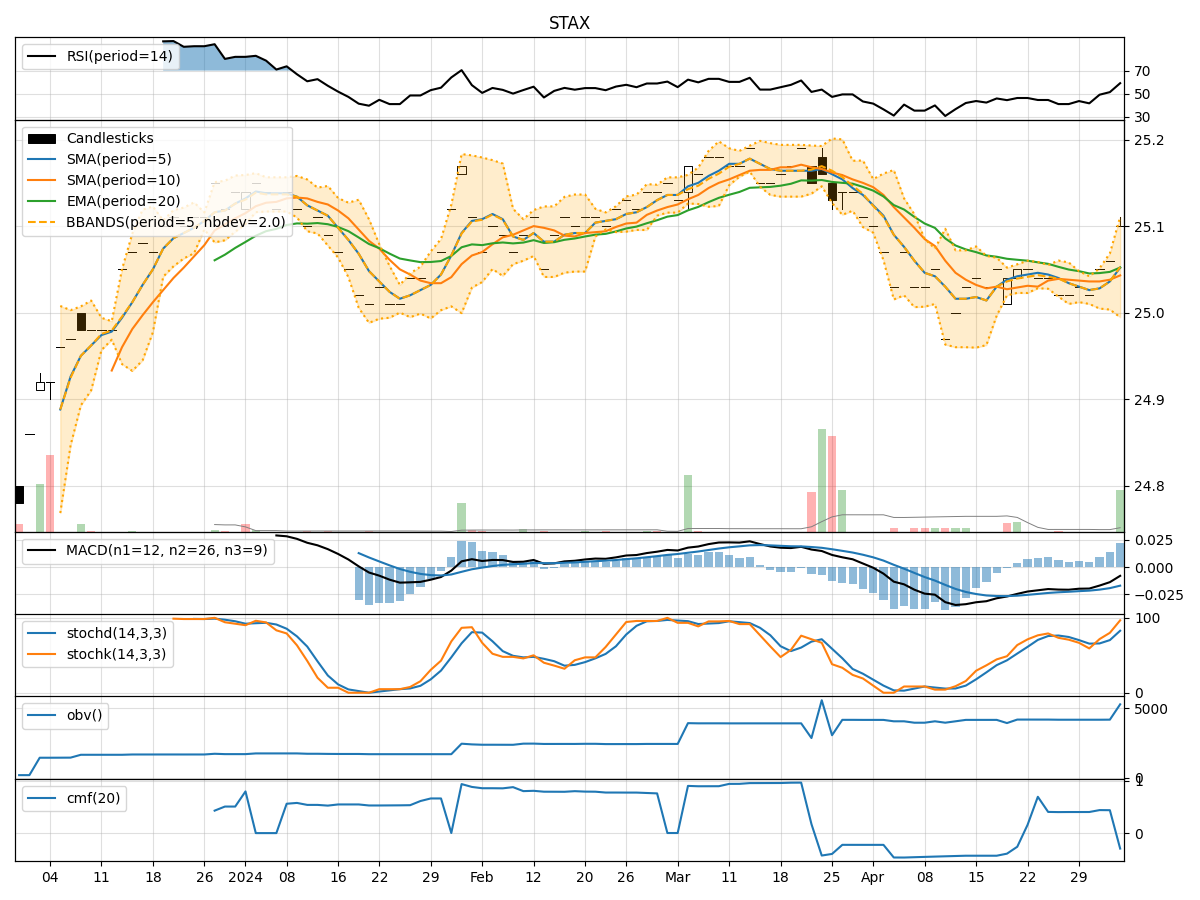
In analyzing the technical indicators for STAX over the last 5 days, we will delve into the trend, momentum, volatility, and volume indicators to provide a comprehensive outlook on the possible stock price movement in the coming days. By examining these key indicators, we aim to offer valuable insights and predictions for informed decision-making.
Trend Indicators:
- Moving Averages (MA): The 5-day MA has been consistently above the closing price, indicating a short-term uptrend.
- MACD: The MACD line has been positive and above the signal line, suggesting bullish momentum.
- EMA: The EMA has been trending upwards, supporting the bullish sentiment.
Key Observation: The trend indicators point towards an upward trend in the stock price.
Momentum Indicators:
- RSI: The RSI has been fluctuating around the overbought territory, indicating strong buying pressure.
- Stochastic Oscillator: Both %K and %D have been in the overbought zone, signaling potential overvaluation.
- Williams %R: The indicator has been in the oversold region, suggesting a possible reversal.
Key Observation: Momentum indicators suggest a mixed sentiment with potential for a pullback due to overbought conditions.
Volatility Indicators:
- Bollinger Bands (BB): The stock price has been trading within the bands, indicating normal volatility.
- Bollinger %B: The %B has been fluctuating within the bands, reflecting price consolidation.
- Average True Range (ATR): The ATR has been relatively stable, indicating consistent volatility levels.
Key Observation: Volatility indicators suggest a sideways movement with no significant breakout.
Volume Indicators:
- On-Balance Volume (OBV): The OBV has been relatively flat, indicating a balance between buying and selling pressure.
- Chaikin Money Flow (CMF): The CMF has been negative, suggesting outflow of money from the stock.
Key Observation: Volume indicators reflect a neutral stance with no clear direction in buying or selling pressure.
Conclusion:
Based on the analysis of trend, momentum, volatility, and volume indicators, the next few days for STAX are likely to see upward movement in the stock price, supported by the bullish trend indicators. However, the overbought conditions in momentum indicators may lead to a short-term pullback before resuming the uptrend. The volatility indicators suggest a sideways movement with no significant breakout expected. Volume indicators indicate a neutral stance, emphasizing the need for cautious monitoring of buying and selling pressure.
Recommendation:
- Short-term Traders: Consider taking profits or setting stop-loss orders due to potential overbought conditions.
- Long-term Investors: Hold positions with a watchful eye on momentum indicators for possible entry points.
- Risk Management: Implement proper risk management strategies to navigate potential volatility and market uncertainties.
In conclusion, while the overall outlook for STAX is bullish in the near term, it is essential to remain vigilant and adapt to changing market dynamics for optimal decision-making.