Technical Analysis of STCE 2024-05-10
Overview:
In analyzing the technical indicators for STCE over the last 5 days, we will delve into the trend, momentum, volatility, and volume indicators to provide a comprehensive assessment of the stock's potential price movement. By examining these key factors, we aim to offer valuable insights and predictions for the upcoming days.
Trend Analysis:
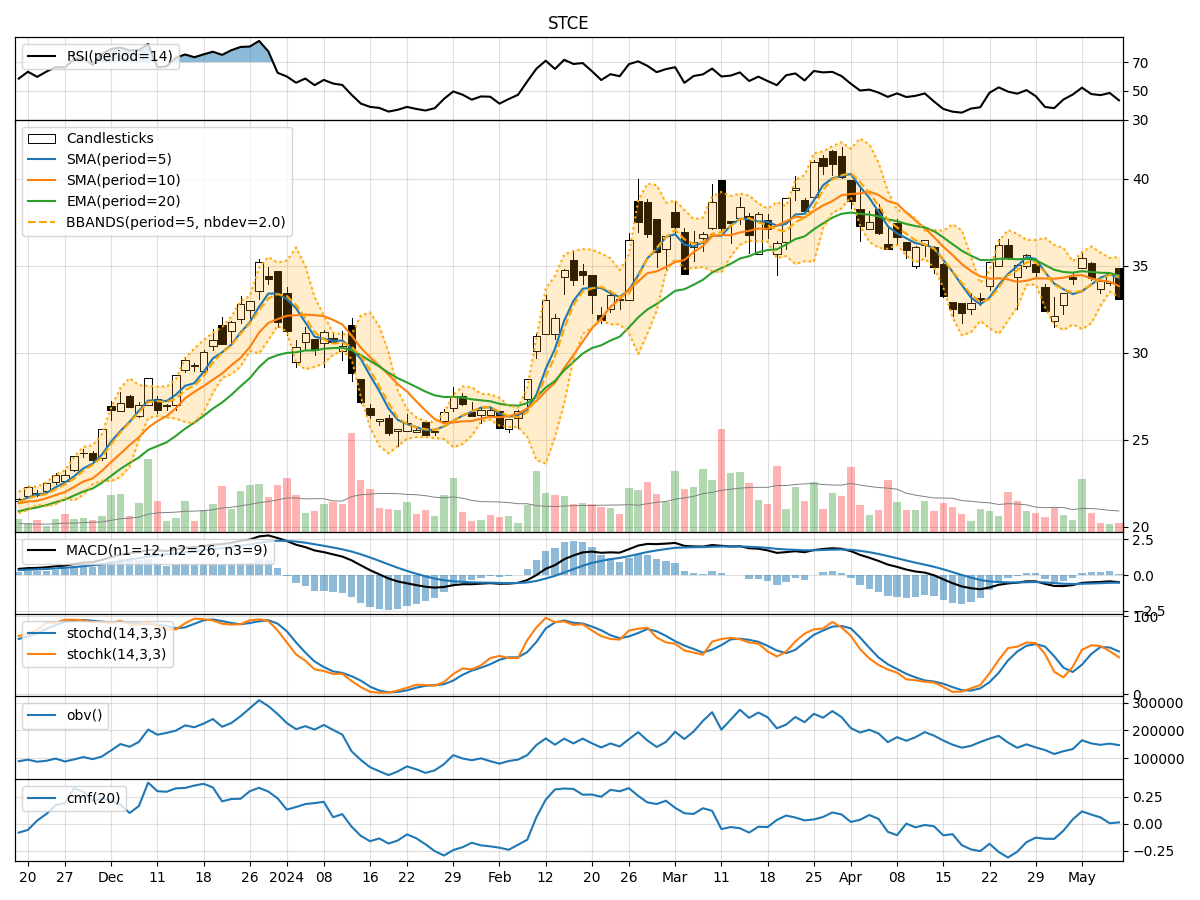
- Moving Averages (MA): The 5-day Moving Average (MA) has been fluctuating around the 34 level, indicating a relatively stable trend in the short term.
- MACD: The Moving Average Convergence Divergence (MACD) has been consistently negative, suggesting a bearish momentum in the stock.
- EMA: The Exponential Moving Average (EMA) has been declining gradually, reflecting a downward trend in the stock price.
Key Observation: The trend indicators point towards a bearish sentiment in the stock price movement.
Momentum Analysis:
- RSI: The Relative Strength Index (RSI) has been hovering around the mid-level, indicating a neutral momentum in the stock.
- Stochastic Oscillator: Both %K and %D of the Stochastic Oscillator have been declining, signaling a weakening momentum.
- Williams %R: The Williams %R is in the oversold territory, suggesting a potential reversal in the stock price.
Key Observation: The momentum indicators suggest a neutral to bearish outlook for the stock.
Volatility Analysis:
- Bollinger Bands: The Bollinger Bands have been narrowing, indicating decreasing volatility in the stock price.
- Bollinger %B: The %B indicator is relatively low, suggesting the stock is trading near the lower band.
- Average True Range (ATR): The ATR has been decreasing, reflecting reduced price volatility.
Key Observation: Volatility indicators point towards a low volatility environment for the stock.
Volume Analysis:
- On-Balance Volume (OBV): The OBV has been fluctuating, indicating mixed buying and selling pressure in the stock.
- Chaikin Money Flow (CMF): The CMF has been relatively low, suggesting a lack of strong buying or selling momentum.
Key Observation: Volume indicators show mixed signals with no clear direction in buying or selling pressure.
Conclusion:
Based on the analysis of trend, momentum, volatility, and volume indicators, the next few days' possible stock price movement for STCE is likely to be sideways with a bearish bias. The bearish trend indicated by the MACD and EMA, coupled with the weakening momentum from the RSI and Stochastic Oscillator, suggests a potential downside risk. Additionally, the low volatility environment and mixed volume signals further support a sideways movement with a bearish undertone.
Key Conclusion: The stock is likely to experience sideways movement with a bearish bias in the upcoming days. Investors should exercise caution and consider risk management strategies in their trading decisions.