Technical Analysis of STLG 2024-05-10
Overview:
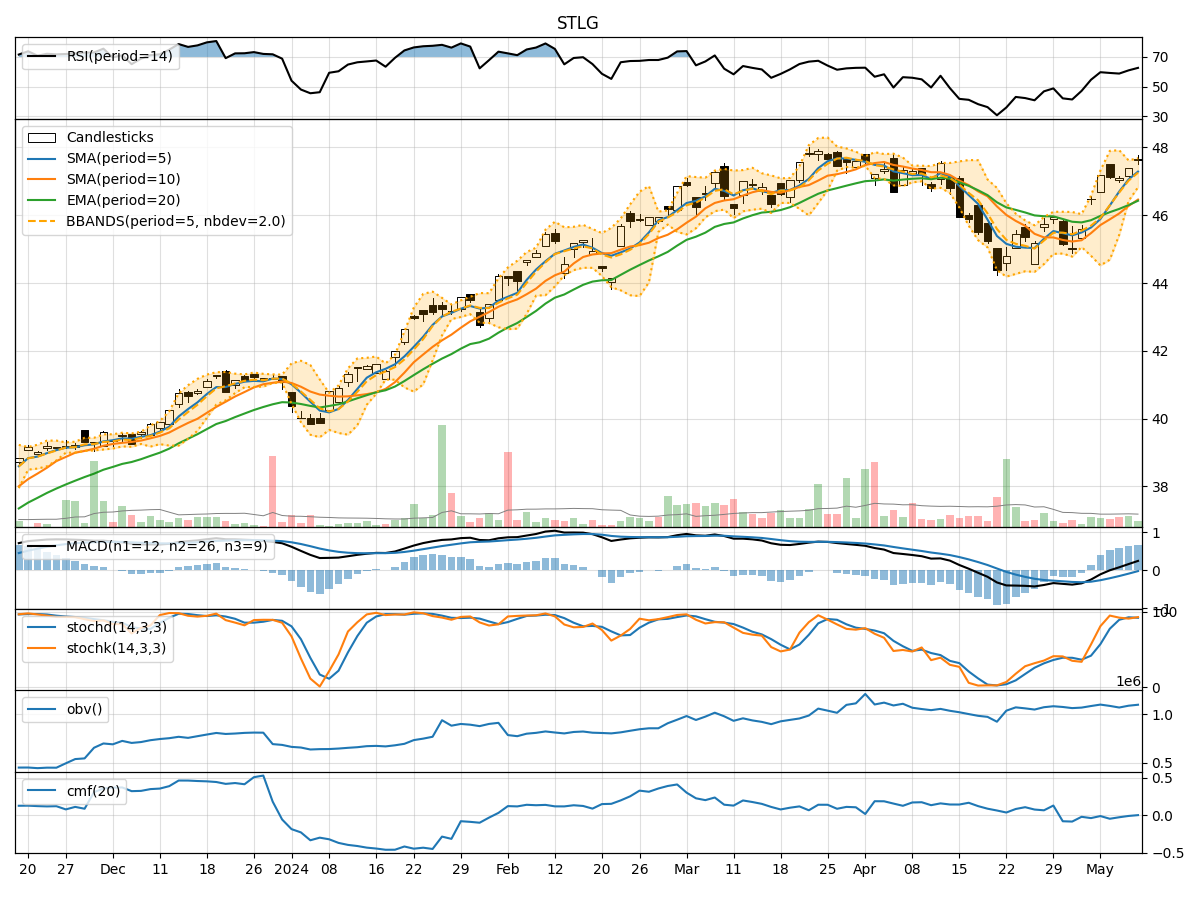
In the last 5 trading days, STLG stock has shown a consistent uptrend in its closing price, accompanied by increasing trading volumes. The moving averages have been trending upwards, indicating a positive momentum. The MACD and RSI have also been showing bullish signals. However, the Bollinger Bands are narrowing, suggesting a potential decrease in volatility. Overall, the stock seems to be in a strong bullish phase.
Trend Analysis:
- Moving Averages (MA): The 5-day MA has been consistently above the 10-day SMA, indicating a short-term bullish trend. The EMA(20) has been steadily rising, supporting the bullish momentum.
- MACD: The MACD line has been above the signal line for the past 5 days, with both lines trending upwards. The MACD histogram has been increasing, indicating a strengthening bullish trend.
Momentum Analysis:
- RSI: The RSI has been in the overbought territory for the last few days, suggesting strong buying momentum. However, it's important to note that an overbought RSI could also signal a potential reversal.
- Stochastic Oscillator: Both %K and %D lines of the Stochastic Oscillator have been in the overbought zone, indicating a strong upward momentum. This could potentially lead to a continuation of the bullish trend.
Volatility Analysis:
- Bollinger Bands: The Bollinger Bands have been narrowing, indicating decreasing volatility. This could suggest a period of consolidation or a potential decrease in price fluctuations in the near future.
Volume Analysis:
- On-Balance Volume (OBV): The OBV has been showing a slight increase over the last 5 days, indicating that buying volume has been slightly outweighing selling volume. This supports the bullish outlook.
- Chaikin Money Flow (CMF): The CMF has been negative but trending slightly upwards, suggesting that money flow into the stock is increasing. This aligns with the overall bullish sentiment.
Conclusion:
Based on the technical indicators analyzed, the stock is currently in a strong bullish phase. The uptrend in closing prices, supported by positive momentum indicators like the MACD and RSI, indicates a potential continuation of the bullish trend in the next few days. However, the narrowing Bollinger Bands suggest a possible decrease in volatility and a period of consolidation. Traders and investors should closely monitor the RSI for potential overbought conditions that could signal a short-term reversal. Overall, the outlook for STLG stock in the next few days is bullish with a possibility of consolidation.