Technical Analysis of STNC 2024-05-10
Overview:
In analyzing the technical indicators for STNC over the last 5 days, we will delve into the trend, momentum, volatility, and volume indicators to provide a comprehensive outlook on the possible stock price movement in the coming days. By examining these key aspects, we aim to offer valuable insights and predictions for informed decision-making.
Trend Analysis:
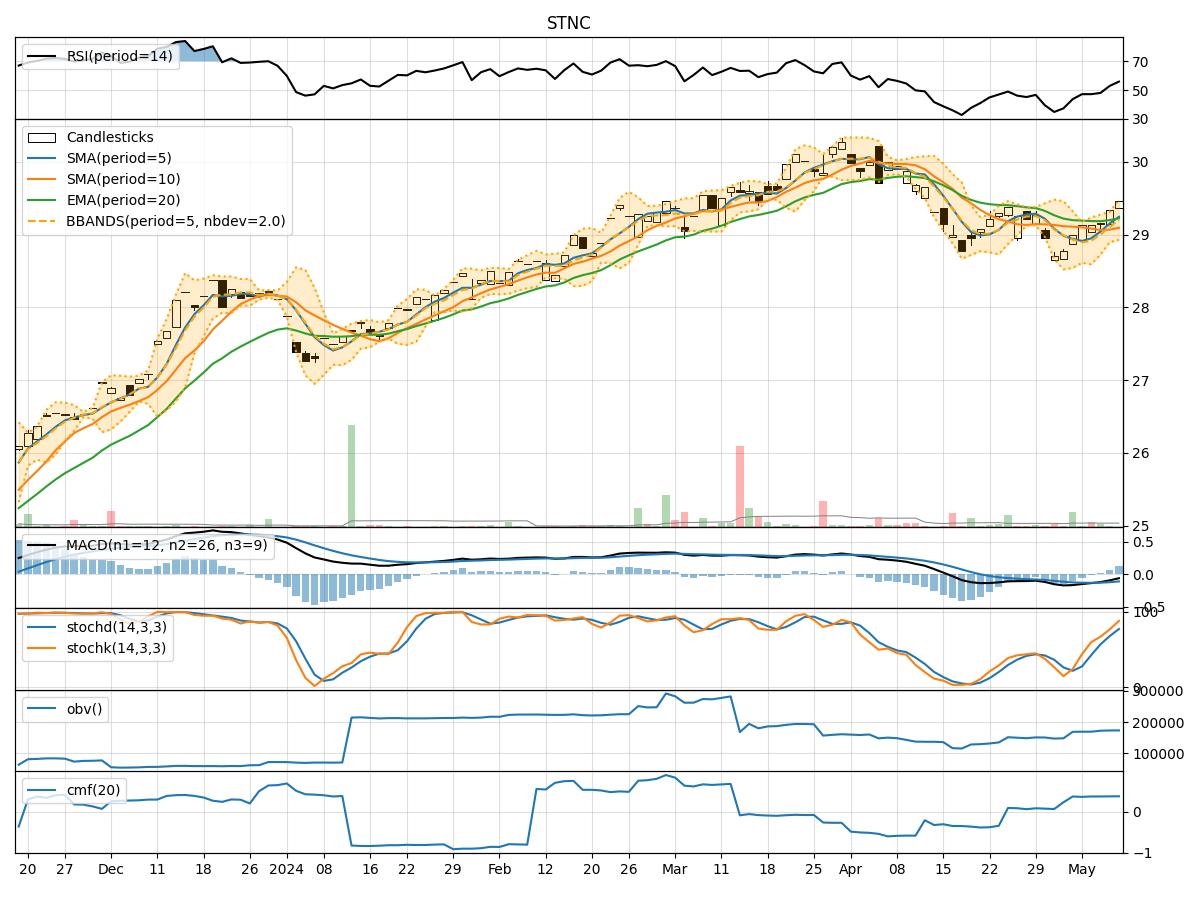
- Moving Averages (MA): The 5-day MA has been gradually increasing, indicating a positive trend in the short term.
- MACD: The MACD line has been consistently below the signal line, suggesting a bearish momentum.
- EMA: The EMA has shown a slight upward trend, indicating potential bullish momentum.
Momentum Analysis:
- RSI: The RSI has been increasing, indicating strengthening momentum.
- Stochastic Oscillator: Both %K and %D have been rising, signaling increasing buying pressure.
- Williams %R: The indicator has been moving towards the oversold region, suggesting a potential reversal.
Volatility Analysis:
- Bollinger Bands (BB): The stock price has been trading within the bands, indicating a period of consolidation.
- BB Width: The width of the bands has been relatively stable, suggesting low volatility.
- BB %B: The %B indicator has been fluctuating around the midline, indicating a balanced market sentiment.
Volume Analysis:
- On-Balance Volume (OBV): The OBV has shown a slight decrease, indicating some distribution.
- Chaikin Money Flow (CMF): The CMF has been positive, suggesting buying pressure in the market.
Key Observations:
- The trend indicators show a mixed picture with a positive short-term MA but a bearish MACD.
- Momentum indicators suggest a strengthening momentum with potential buying pressure.
- Volatility indicators point towards a period of consolidation with low volatility.
- Volume indicators indicate a slight decrease in OBV but overall positive buying pressure according to CMF.
Conclusion:
Based on the analysis of the technical indicators, the stock price of STNC is likely to experience further upward movement in the coming days. The positive momentum indicated by the RSI and Stochastic Oscillator, coupled with the increasing short-term MA, suggests a bullish outlook. Although the MACD remains bearish, the overall trend seems to favor a continuation of the upward movement. Traders and investors may consider buying opportunities in anticipation of a potential price increase.