Technical Analysis of STPZ 2024-05-10
Overview:
In analyzing the technical indicators for STPZ over the last 5 days, we will delve into the trend, momentum, volatility, and volume indicators to provide a comprehensive outlook on the possible stock price movement. By examining these key aspects, we aim to offer valuable insights and predictions for the upcoming days.
Trend Analysis:
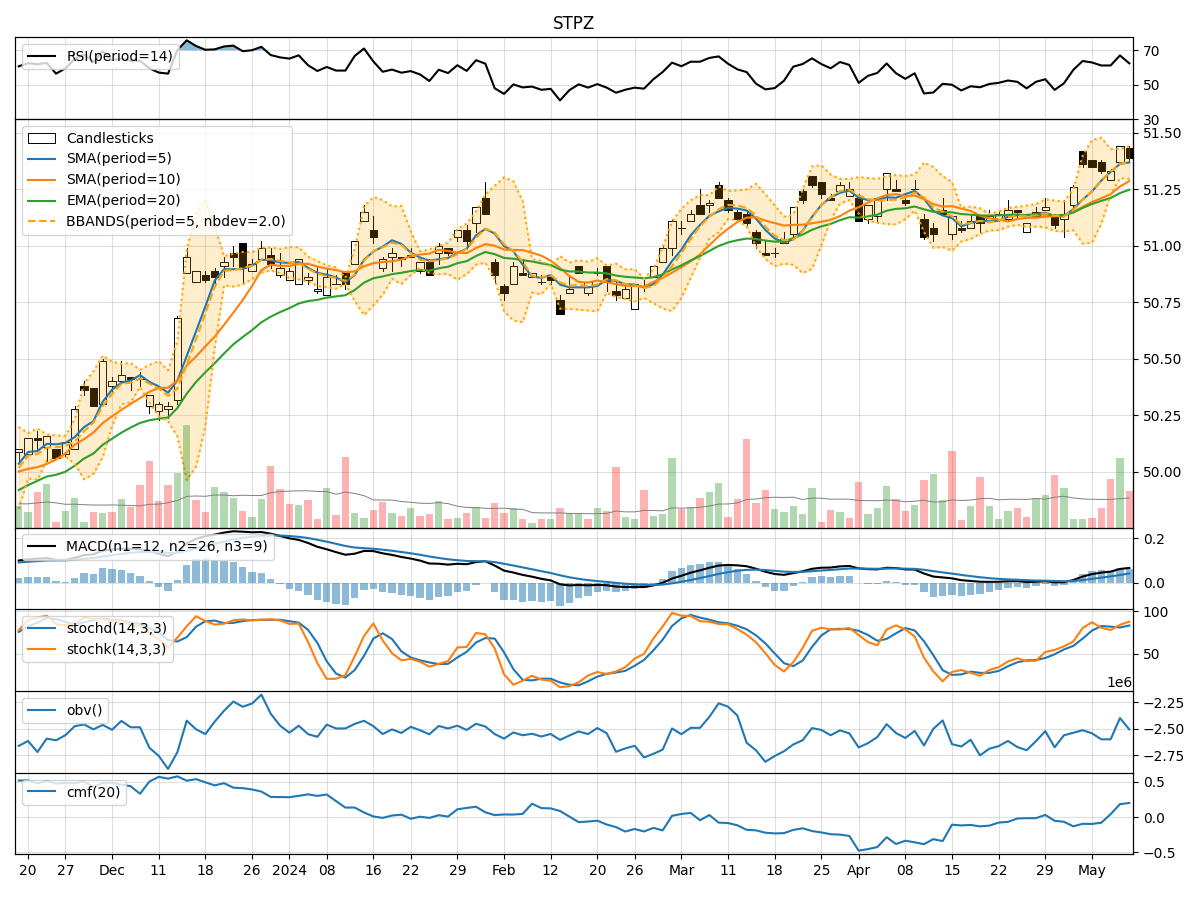
- Moving Averages (MA): The 5-day Moving Average (MA) has been consistently above the Simple Moving Average (SMA) and Exponential Moving Average (EMA), indicating a bullish trend.
- MACD: The MACD line has been consistently above the signal line, with both lines showing an upward trend, suggesting bullish momentum.
- RSI: The Relative Strength Index (RSI) has been fluctuating but generally staying within the neutral to overbought range, indicating a balanced market sentiment.
Momentum Analysis:
- Stochastic Oscillator: Both %K and %D lines of the Stochastic Oscillator have been in the overbought territory, suggesting a potential reversal or consolidation.
- Williams %R: The Williams %R has been fluctuating but recently showed oversold conditions, indicating a possible buying opportunity.
Volatility Analysis:
- Bollinger Bands (BB): The stock price has been trading within the Bollinger Bands, with the bands narrowing, suggesting a period of low volatility.
- BB% (Bollinger Band %B): The %B indicator has been fluctuating around the midline, indicating a balanced market sentiment.
Volume Analysis:
- On-Balance Volume (OBV): The OBV has shown mixed signals, with some days indicating distribution and others accumulation, reflecting uncertainty in volume flow.
- Chaikin Money Flow (CMF): The CMF has been positive, indicating buying pressure in the market.
Conclusion:
Based on the analysis of the technical indicators, the next few days for STPZ could see sideways movement or consolidation. The bullish trend indicated by moving averages and MACD may face resistance due to overbought conditions in momentum indicators like the Stochastic Oscillator. The volatility is low, suggesting a lack of significant price movements, while volume indicators show mixed signals.
Recommendation:
- Short-term Traders: Consider taking profits or reducing positions as the stock may enter a consolidation phase.
- Long-term Investors: Monitor the price action closely for a potential entry point during a pullback or consolidation.
It is crucial to monitor the price action closely and consider additional fundamental analysis to make well-informed investment decisions.