Technical Analysis of STRV 2024-05-10
Overview:
In analyzing the technical indicators for STRV over the last 5 days, we will delve into the trend, momentum, volatility, and volume indicators to provide a comprehensive outlook on the possible stock price movement in the coming days. By examining these key aspects, we aim to offer valuable insights and predictions to guide your investment decisions.
Trend Indicators:
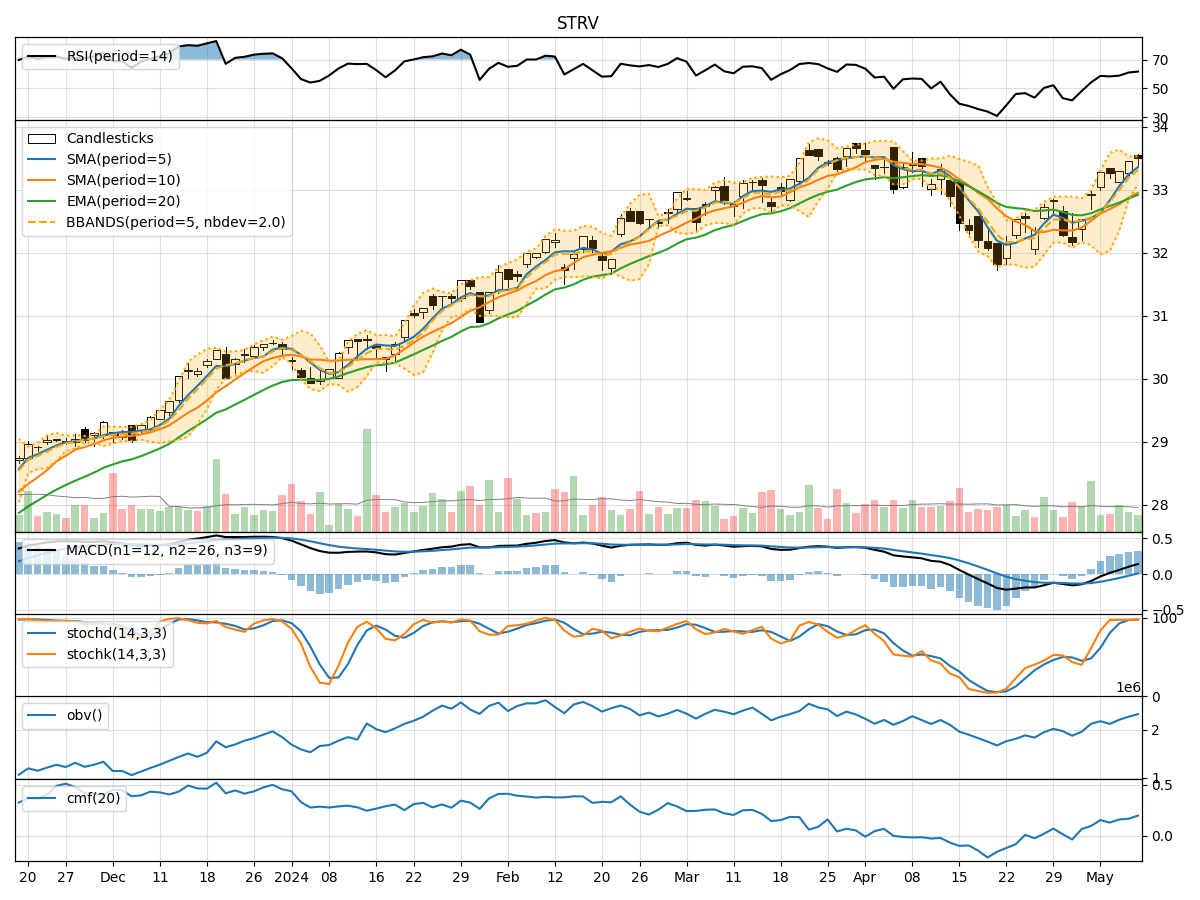
- Moving Averages (MA): The 5-day Moving Average has been consistently above the Simple Moving Average (SMA) and Exponential Moving Average (EMA), indicating a bullish trend.
- MACD: The MACD line has been consistently above the signal line, with both lines showing an upward trend, suggesting bullish momentum.
Momentum Indicators:
- RSI: The Relative Strength Index (RSI) has been in the neutral to slightly overbought territory, indicating potential strength in the stock.
- Stochastic Oscillator: Both %K and %D have been in the overbought zone, suggesting a strong upward momentum.
Volatility Indicators:
- Bollinger Bands (BB): The stock price has been trading within the upper Bollinger Band, indicating an increased volatility but also potential overbought conditions.
Volume Indicators:
- On-Balance Volume (OBV): The OBV has shown a mixed trend, with some days experiencing selling pressure and others showing accumulation.
- Chaikin Money Flow (CMF): The CMF has been positive, indicating buying pressure in the stock.
Key Observations:
- The trend indicators suggest a strong bullish sentiment, supported by the moving averages and MACD.
- Momentum indicators indicate a potential overbought condition, especially with the RSI and Stochastic Oscillator in the higher range.
- Volatility has increased, as seen in the Bollinger Bands, which could lead to sharp price movements.
- Volume indicators show mixed signals, with OBV reflecting some distribution while CMF signals buying pressure.
Conclusion:
Based on the analysis of the technical indicators, the stock is likely to experience a short-term pullback or consolidation in the coming days due to the overbought conditions indicated by the momentum indicators. However, the overall trend remains bullish, supported by the moving averages and MACD. Traders should exercise caution and consider potential profit-taking opportunities in the near future.