Technical Analysis of STXD 2024-05-10
Overview:
In analyzing the technical indicators for STXD over the last 5 days, we will delve into the trend, momentum, volatility, and volume indicators to provide a comprehensive outlook on the possible stock price movement in the coming days. By examining these key aspects, we aim to offer valuable insights and predictions for potential investors.
Trend Analysis:
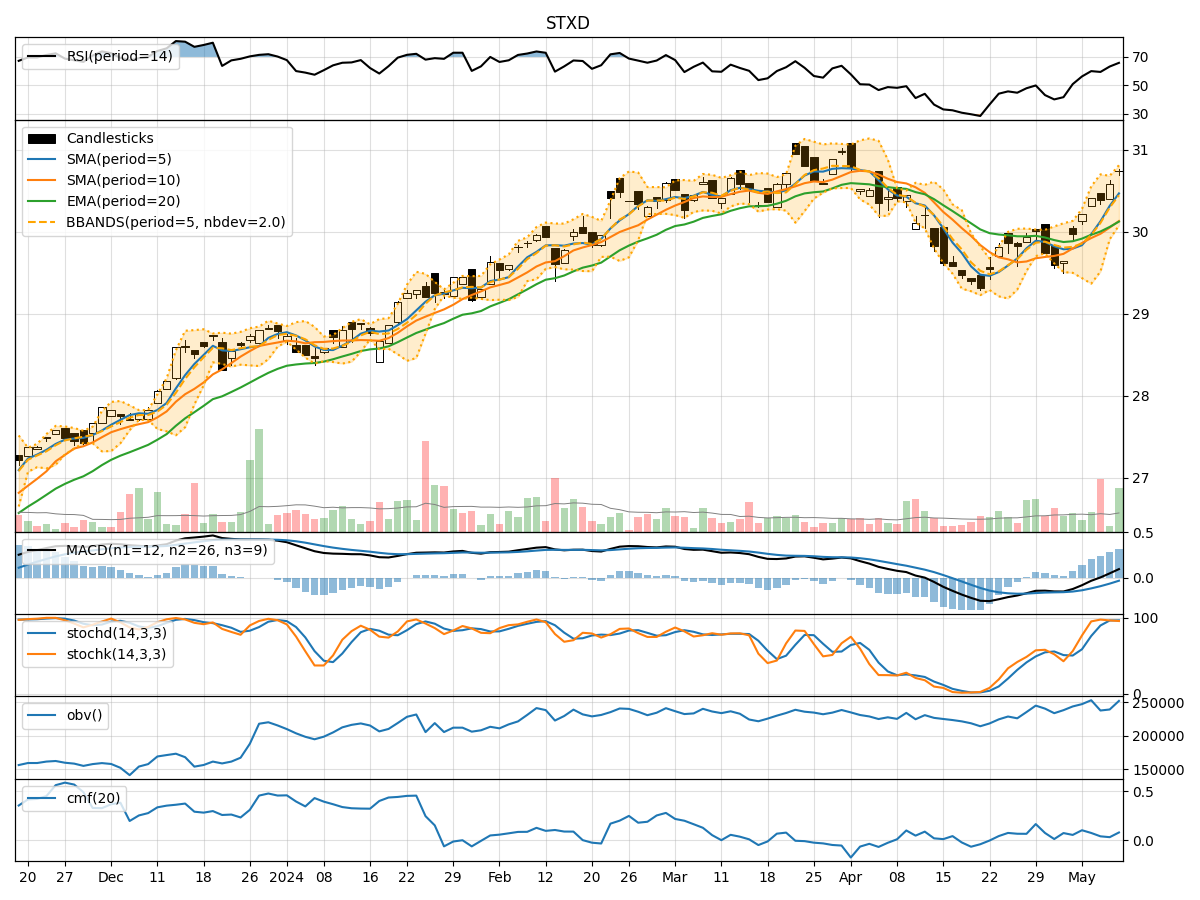
- Moving Averages (MA): The 5-day MA has been consistently above the closing prices, indicating a bullish trend.
- MACD: The MACD line has been above the signal line, suggesting a bullish momentum.
- EMA: The EMA has been trending upwards, supporting the bullish sentiment.
Momentum Analysis:
- RSI: The RSI has been in the overbought territory, indicating a strong bullish momentum.
- Stochastic Oscillator: Both %K and %D have been in the overbought zone, signaling a potential reversal.
- Williams %R: The indicator has been consistently in the oversold region, suggesting a bullish sentiment.
Volatility Analysis:
- Bollinger Bands: The stock price has been trading within the upper Bollinger Band, indicating high volatility.
- Bollinger Band Width: The band width has been narrowing, suggesting a potential decrease in volatility.
Volume Analysis:
- On-Balance Volume (OBV): The OBV has been fluctuating, indicating mixed sentiment among investors.
- Chaikin Money Flow (CMF): The CMF has been positive, suggesting buying pressure in the market.
Key Observations:
- The trend indicators point towards a strong bullish sentiment in the stock.
- Momentum indicators show a potential overbought condition, signaling a need for caution.
- Volatility has been high but is showing signs of potential stabilization.
- Volume indicators reflect mixed sentiment among investors.
Conclusion:
Based on the analysis of the technical indicators, the stock is likely to experience a short-term pullback or consolidation due to the overbought conditions indicated by the momentum indicators. However, the overall trend remains bullish, supported by the moving averages and MACD. Investors should closely monitor the price action and volume dynamics in the coming days to assess the sustainability of the current uptrend. Exercise caution and consider potential profit-taking strategies in the near future.