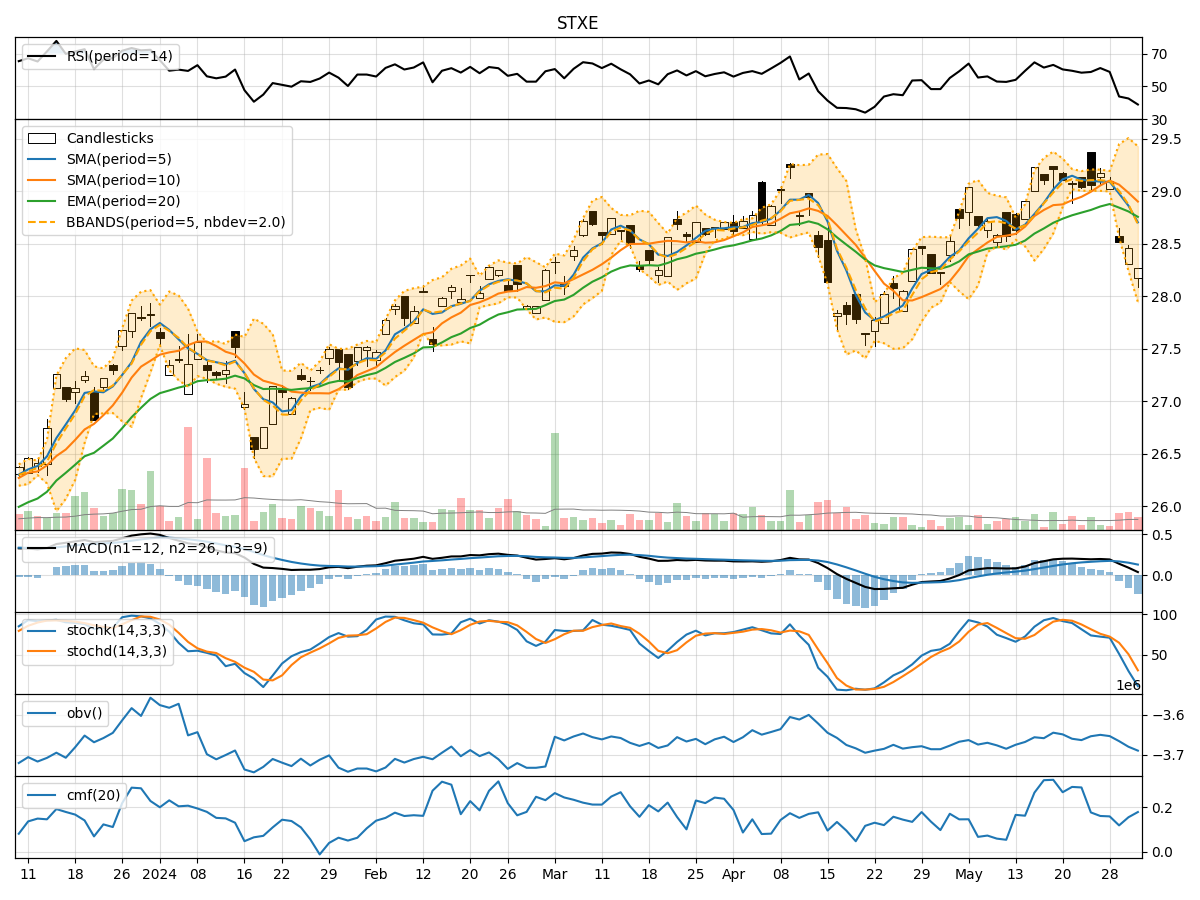
Technical Analysis of STXE 2024-05-10
Overview:
In the last 5 trading days, the STXE stock has shown mixed signals across various technical indicators. The trend indicators suggest a slightly bullish sentiment, with the moving averages trending upwards. Momentum indicators show a weakening trend, with decreasing RSI values and stochastic indicators moving towards oversold levels. Volatility indicators indicate a narrowing of the Bollinger Bands, suggesting a potential decrease in price fluctuations. Volume indicators show a slight increase in On-Balance Volume (OBV) but a relatively stable Chaikin Money Flow (CMF).
Trend Indicators:
- Moving Averages (MA): The 5-day MA is above the 10-day SMA, indicating a short-term bullish trend.
- MACD: The MACD line is above the signal line, indicating a bullish momentum.
- MACD Histogram: The histogram is positive, suggesting increasing bullish momentum.
Momentum Indicators:
- RSI: The RSI has been decreasing, indicating a weakening momentum.
- Stochastic Oscillator: Both %K and %D are moving towards oversold levels, suggesting a potential reversal.
Volatility Indicators:
- Bollinger Bands (BB): The bands are narrowing, indicating decreasing volatility.
- Bollinger %B (BBP): The %B is below 0.5, suggesting a potential consolidation phase.
Volume Indicators:
- On-Balance Volume (OBV): The OBV has shown a slight increase, indicating some buying pressure.
- Chaikin Money Flow (CMF): The CMF is relatively stable, suggesting a neutral money flow trend.
Key Observations:
- The trend indicators show a bullish bias, supported by the positive MACD and moving averages.
- Momentum indicators, particularly the RSI and stochastic oscillators, indicate a potential weakening of the current uptrend.
- Volatility indicators suggest a decrease in price fluctuations, possibly leading to a consolidation phase.
- Volume indicators show a slight increase in buying pressure but overall neutral money flow.
Conclusion:
Based on the analysis of the technical indicators, the next few days' possible stock price movement for STXE is likely to experience a consolidation phase. The bullish trend indicated by moving averages and MACD may face resistance due to weakening momentum signals from RSI and stochastic oscillators. The narrowing Bollinger Bands and stable CMF further support the view of a potential sideways movement. Traders should be cautious of a possible pullback or range-bound trading in the coming days.