Technical Analysis of STXG 2024-05-10
Overview:
In analyzing the technical indicators for STXG over the last 5 days, we will delve into the trend, momentum, volatility, and volume indicators to provide a comprehensive outlook on the possible stock price movement in the coming days.
Trend Analysis:
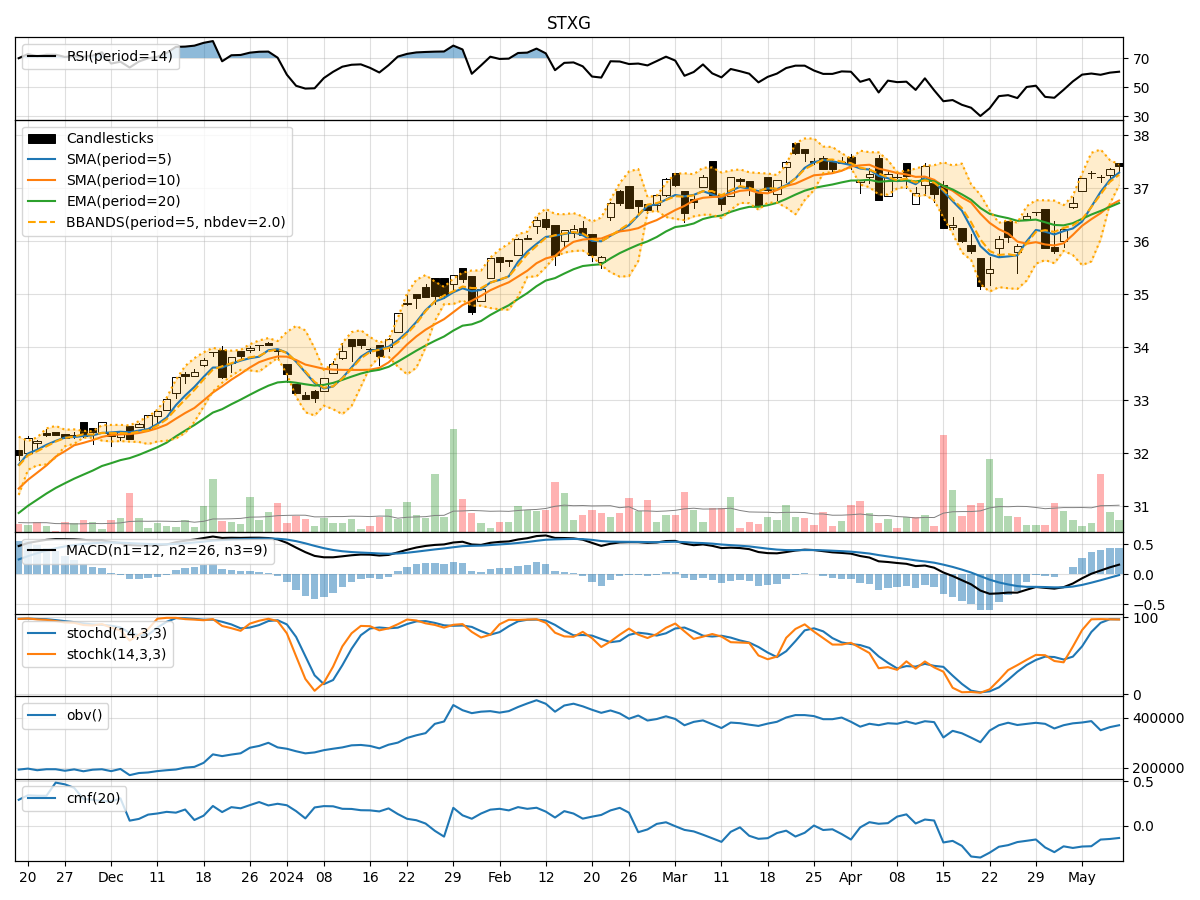
- Moving Averages (MA): The 5-day Moving Average (MA) has been consistently above the Simple Moving Average (SMA) and Exponential Moving Average (EMA), indicating a bullish trend.
- MACD: The MACD line has been consistently above the signal line, with the MACD Histogram showing an increasing positive trend, further supporting a bullish sentiment.
Momentum Analysis:
- RSI: The Relative Strength Index (RSI) has been trending upwards, indicating increasing buying momentum.
- Stochastic Oscillator: Both %K and %D have been consistently high, suggesting strong upward momentum.
- Williams %R: The Williams %R is in the oversold territory, indicating a potential reversal in the short term.
Volatility Analysis:
- Bollinger Bands: The stock price has been trading within the Bollinger Bands, with the bands narrowing, indicating decreasing volatility.
- Bollinger %B: The %B indicator is above 0.8, suggesting the stock is trading near the upper band, potentially signaling an overbought condition.
Volume Analysis:
- On-Balance Volume (OBV): The OBV has been declining, indicating a divergence between price and volume, which could signal a potential trend reversal.
- Chaikin Money Flow (CMF): The CMF has been negative, indicating selling pressure in the market.
Conclusion:
Based on the analysis of the technical indicators: - Trend: The trend is bullish based on moving averages and MACD. - Momentum: Momentum indicators suggest strong buying momentum in the stock. - Volatility: Volatility is decreasing, potentially leading to a period of consolidation. - Volume: The declining OBV and negative CMF indicate weakening buying pressure.
Possible Stock Price Movement:
Considering the overall analysis, the stock is likely to experience a short-term consolidation phase after the recent bullish trend. Traders should watch for potential reversal signals as the stock may enter a sideways movement before resuming its upward trajectory. It is advisable to monitor key support and resistance levels for potential entry or exit points.
Key Recommendations:
- Short-term Traders: Consider taking profits or tightening stop-loss levels during the consolidation phase.
- Long-term Investors: Hold positions but remain vigilant for any signs of trend reversal.
- Risk Management: Implement proper risk management strategies to protect capital in case of unexpected market movements.
Disclaimer:
Remember that technical analysis is not foolproof and should be used in conjunction with other forms of analysis. Market conditions can change rapidly, so it is essential to stay informed and adapt your strategies accordingly. Consult with a financial advisor before making any investment decisions.