Technical Analysis of STXK 2024-05-10
Overview:
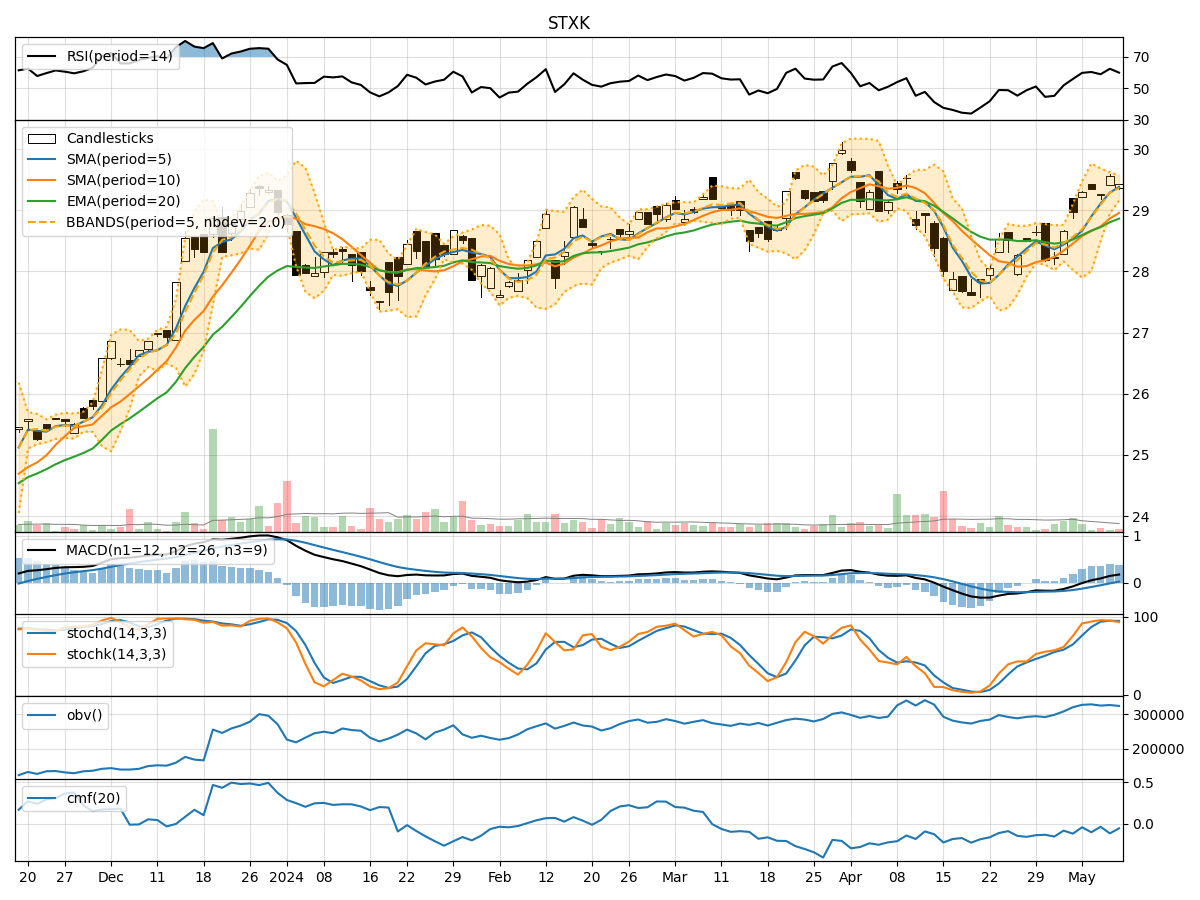
In the last 5 trading days, the stock price of STXK has shown a slight upward trend with fluctuations in volume. The trend indicators suggest a positive momentum, supported by increasing moving averages and MACD values. Momentum indicators indicate a slightly overbought condition, while volatility indicators show a narrowing Bollinger Bands range. Volume indicators reflect a mixed sentiment with a slight decrease in On-Balance Volume (OBV) and Chaikin Money Flow (CMF).
Trend Indicators:
- Moving averages (MA) have been consistently rising, indicating a bullish trend.
- MACD values have been increasing, suggesting strengthening bullish momentum.
- The stock price is trading above both short-term and long-term moving averages, indicating a positive trend.
Momentum Indicators:
- Relative Strength Index (RSI) is in the neutral zone, suggesting a balanced momentum.
- Stochastic indicators show the stock is in the overbought territory, indicating a potential reversal.
- Williams %R (WILLR) is in the oversold region, signaling a possible buying opportunity.
Volatility Indicators:
- Bollinger Bands are narrowing, indicating decreasing volatility and a potential breakout.
- The Bollinger Bands Percentage (BBP) is relatively low, suggesting a period of consolidation.
- Volatility has been decreasing, which could lead to a period of range-bound trading.
Volume Indicators:
- On-Balance Volume (OBV) has slightly decreased, indicating some distribution.
- Chaikin Money Flow (CMF) is negative, suggesting selling pressure in the stock.
Conclusion:
Based on the analysis of technical indicators, the next few days for STXK stock price could see sideways movement or consolidation. The bullish trend may lose some momentum due to overbought conditions indicated by the Stochastic and Williams %R indicators. The narrowing Bollinger Bands and decreasing volatility suggest a potential breakout in either direction. The mixed sentiment in volume indicators implies a lack of strong conviction from market participants.
Key Points: - Trend: Upward - Momentum: Slightly overbought - Volatility: Decreasing - Volume: Mixed
Overall View: The stock is likely to experience a period of consolidation or sideways movement in the next few days, with the potential for a breakout in either direction. Traders should closely monitor key support and resistance levels for potential entry or exit points.