Technical Analysis of STXT 2024-05-10
Overview:
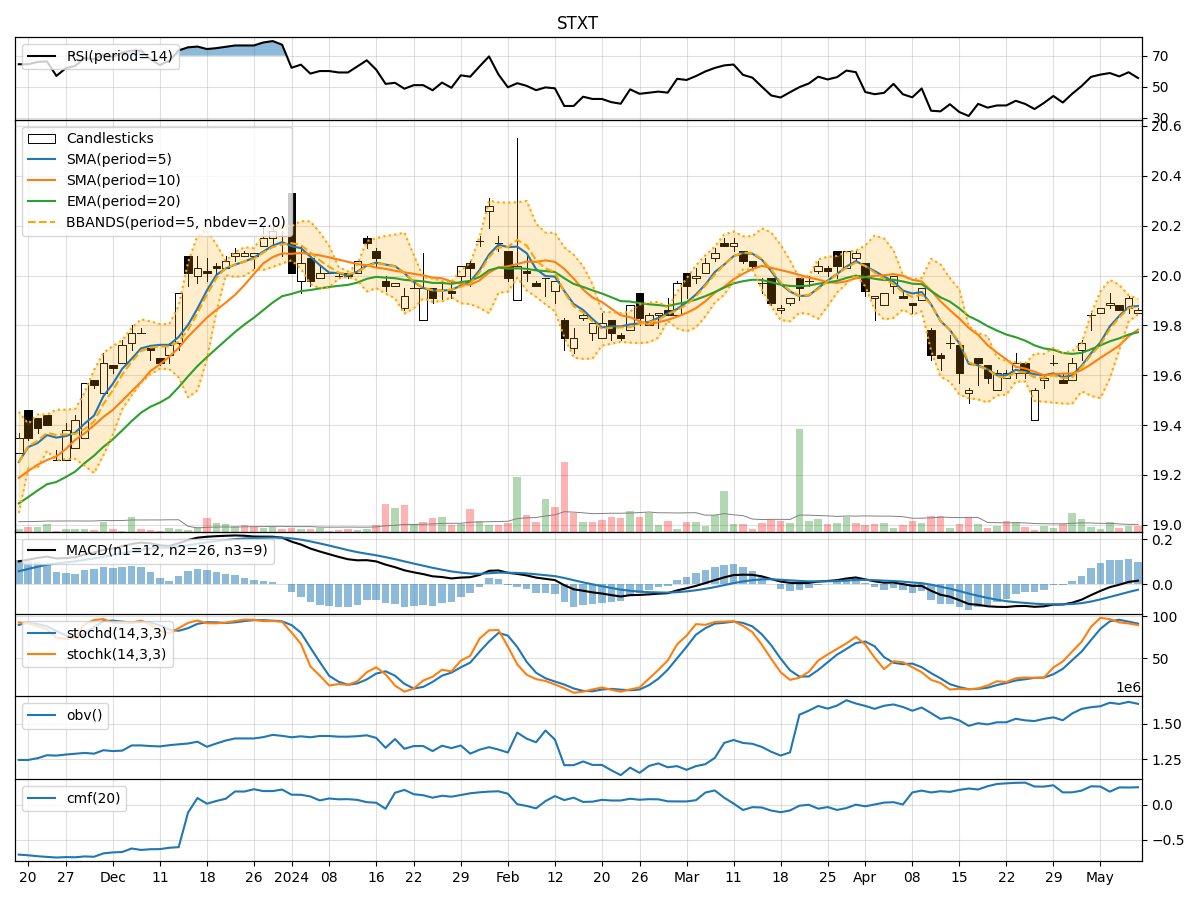
In analyzing the technical indicators for STXT over the last 5 days, we will delve into the trend, momentum, volatility, and volume indicators to provide a comprehensive outlook on the possible stock price movement in the coming days. By examining these key aspects, we aim to offer valuable insights and predictions to guide investment decisions.
Trend Indicators:
- Moving Averages (MA): The 5-day MA has been consistently above the closing price, indicating a short-term uptrend.
- MACD: The MACD line has been trending upwards, with the MACD histogram showing positive values, suggesting bullish momentum.
- EMA: The EMA has been steadily increasing, supporting the bullish trend.
Momentum Indicators:
- RSI: The RSI has been fluctuating around the neutral zone, indicating indecision in the market.
- Stochastic Oscillator: Both %K and %D have been declining, signaling a potential reversal in momentum.
- Williams %R: The indicator has been in oversold territory, suggesting a possible upcoming price correction.
Volatility Indicators:
- Bollinger Bands: The bands have been narrowing, indicating decreasing volatility and a potential price breakout.
- Bollinger %B: The %B indicator has been hovering around the middle, reflecting a balanced market sentiment.
Volume Indicators:
- On-Balance Volume (OBV): The OBV has shown mixed signals, with no clear trend in volume accumulation.
- Chaikin Money Flow (CMF): The CMF has been relatively stable, indicating a neutral money flow trend.
Key Observations:
- The trend indicators suggest a bullish bias, supported by the moving averages and MACD.
- Momentum indicators show signs of potential weakness in the current uptrend, as reflected in the RSI and Stochastic Oscillator.
- Volatility indicators point towards a possible breakout, with Bollinger Bands contracting.
- Volume indicators do not provide a clear direction, indicating a lack of strong buying or selling pressure.
Conclusion:
Based on the analysis of the technical indicators, the stock price of STXT is likely to experience sideways consolidation in the coming days. While the trend indicators support a bullish view, the momentum indicators suggest a possible correction or consolidation phase. The narrowing Bollinger Bands indicate an impending breakout, which could lead to increased volatility. However, the lack of significant volume movements implies a period of indecision among market participants. Therefore, investors should exercise caution and closely monitor price movements for potential trading opportunities.