Technical Analysis of STXV 2024-05-10
Overview:
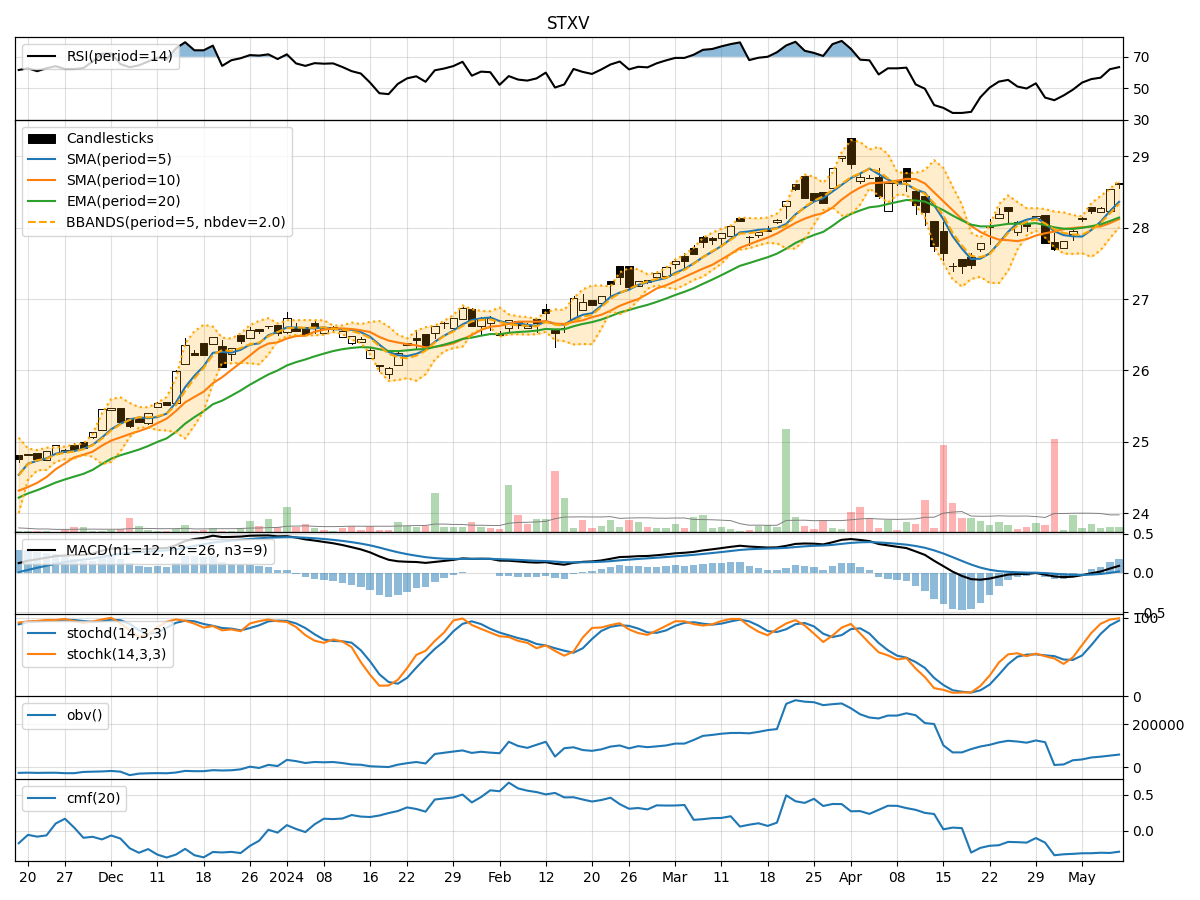
In analyzing the technical indicators for STXV over the last 5 days, we will delve into the trend, momentum, volatility, and volume indicators to provide a comprehensive outlook on the possible stock price movement in the coming days. By examining these key indicators, we aim to offer valuable insights and predictions for informed decision-making.
Trend Indicators:
- Moving Averages (MA): The 5-day MA has been consistently trending upwards, indicating a positive momentum in the short term.
- MACD: The MACD line has been above the signal line, suggesting a bullish trend.
- RSI: The RSI has been increasing, reflecting strengthening buying pressure.
- Bollinger Bands: The price has been trading above the middle Bollinger Band, indicating a potential uptrend.
Momentum Indicators:
- Stochastic Oscillator: Both %K and %D have been in the overbought zone, signaling a strong bullish momentum.
- Williams %R: The indicator has been hovering near the oversold territory, suggesting a potential reversal to the upside.
Volatility Indicators:
- Bollinger Bands Width: The bands have been narrowing, indicating decreasing volatility and a possible consolidation phase.
- Average True Range (ATR): The ATR has shown a decline, further supporting the view of reduced volatility.
Volume Indicators:
- On-Balance Volume (OBV): The OBV has been negative, indicating distribution rather than accumulation.
- Chaikin Money Flow (CMF): The CMF has been negative, suggesting outflow of money from the stock.
Key Observations and Opinions:
- Trend: The stock is in an upward trend based on moving averages and MACD.
- Momentum: Momentum indicators suggest a strong bullish sentiment in the short term.
- Volatility: Volatility is decreasing, potentially leading to a period of consolidation.
- Volume: The negative OBV and CMF indicate selling pressure in the stock.
Conclusion:
Based on the analysis of the technical indicators, the next few days for STXV are likely to see a continuation of the upward trend with strong bullish momentum. However, the decreasing volatility and negative volume indicators suggest a possible consolidation phase before any significant price movements. Traders should monitor key support and resistance levels for potential entry and exit points, considering the overall bullish bias in the stock.