Technical Analysis of SUPL 2024-05-10
Overview:
In analyzing the technical indicators for SUPL over the last 5 days, we will delve into the trend, momentum, volatility, and volume indicators to provide a comprehensive outlook on the possible stock price movement in the coming days. By examining these key aspects, we aim to offer valuable insights and predictions to guide your investment decisions.
Trend Indicators:
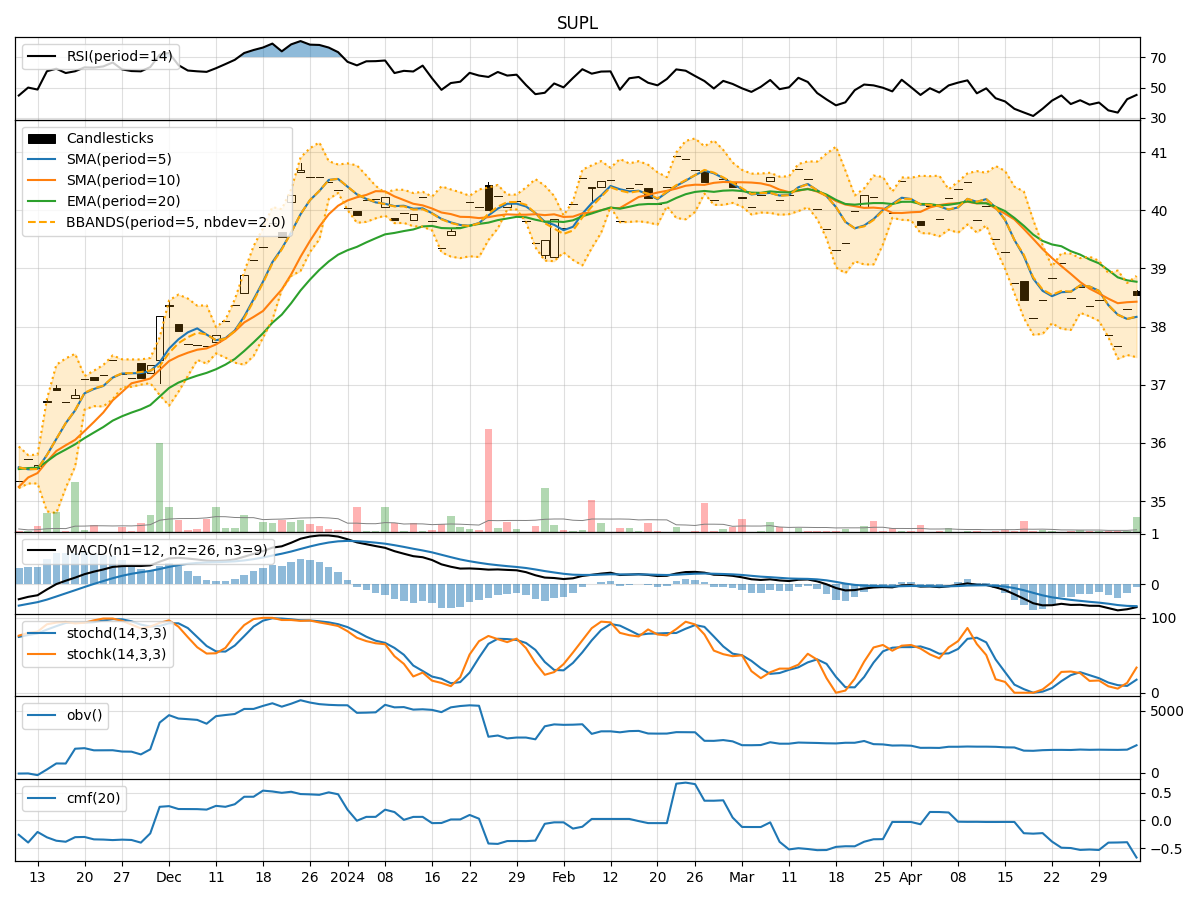
- Moving Averages (MA): The 5-day moving average has been consistently above the closing prices, indicating a short-term uptrend.
- MACD: The MACD line has been negative but showing signs of convergence towards the signal line, suggesting a potential reversal in the short term.
- RSI: The RSI has been gradually increasing, indicating strengthening bullish momentum.
Momentum Indicators:
- Stochastic Oscillator: Both %K and %D have been in overbought territory, signaling a strong bullish momentum.
- Williams %R: The indicator has been hovering around the oversold region, potentially indicating a reversal in the short term.
Volatility Indicators:
- Bollinger Bands: The stock price has been trading within the bands, with the upper band expanding, suggesting increased volatility.
- Bollinger %B: The %B indicator has been fluctuating within the bands, indicating potential price reversals.
Volume Indicators:
- On-Balance Volume (OBV): The OBV has been declining, suggesting selling pressure in the stock.
- Chaikin Money Flow (CMF): The CMF has been negative, indicating a lack of buying pressure.
Key Observations:
- The trend indicators suggest a short-term uptrend in the stock price.
- Momentum indicators indicate a strong bullish momentum but also show signs of potential reversal.
- Volatility indicators point towards increased price fluctuations.
- Volume indicators reflect selling pressure and a lack of significant buying interest.
Conclusion:
Based on the analysis of the technical indicators, the stock of SUPL is likely to experience further upward movement in the coming days. The bullish momentum indicated by the stochastic oscillator and RSI, coupled with the positive trend in moving averages, supports a bullish view. However, caution is advised due to the potential reversal signals in the momentum indicators and the negative volume indicators. Traders should closely monitor price action and key support/resistance levels for confirmation of the upward trend.