Technical Analysis of SUPP 2024-05-10
Overview:
In analyzing the technical indicators for the last 5 days of SUPP stock, we will delve into the trend, momentum, volatility, and volume indicators to provide a comprehensive outlook on the possible stock price movement in the upcoming days. By examining these key indicators, we aim to offer valuable insights and predictions to guide your investment decisions.
Trend Indicators:
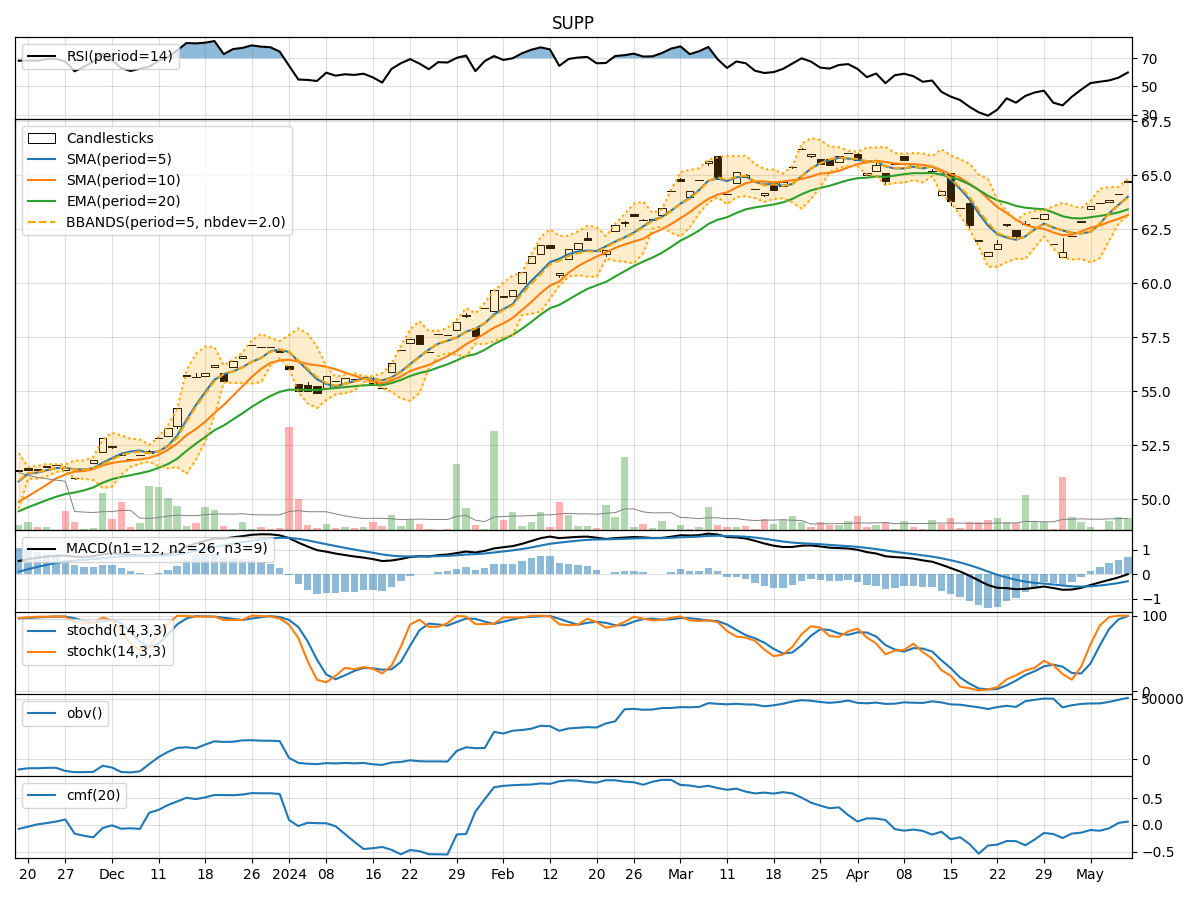
- Moving Averages (MA): The 5-day MA has been consistently above the 10-day SMA, indicating a short-term bullish trend.
- MACD: The MACD line has been gradually increasing, with the MACD histogram showing positive values, suggesting bullish momentum.
- RSI: The RSI has been trending upwards, indicating increasing buying pressure.
Key Observation: The trend indicators suggest a bullish sentiment in the short term.
Momentum Indicators:
- Stochastic Oscillator: Both %K and %D have been consistently high, indicating strong upward momentum.
- Williams %R: The indicator has been consistently at 0, signaling overbought conditions.
Key Observation: Momentum indicators reflect strong buying momentum and potential overbought conditions.
Volatility Indicators:
- Bollinger Bands (BB): The stock price has been consistently trading above the middle BB, indicating an uptrend.
- BB Width: The BB width has been narrowing, suggesting decreasing volatility.
Key Observation: Volatility indicators point towards a narrowing range and decreasing volatility.
Volume Indicators:
- On-Balance Volume (OBV): The OBV has been steadily increasing, indicating accumulation by investors.
- Chaikin Money Flow (CMF): The CMF has been slightly positive, suggesting money flow into the stock.
Key Observation: Volume indicators show positive accumulation and money flow into the stock.
Conclusion:
Based on the analysis of the technical indicators, the stock is likely to continue its upward momentum in the short term. The trend indicators, momentum indicators, and volume indicators all point towards a bullish outlook. However, caution should be exercised as the stock is currently in overbought territory according to the Williams %R indicator.
Recommendation:
- Short Term: Consider holding or adding to positions as the stock is expected to continue its upward trend.
- Risk Management: Monitor the stock closely for signs of a potential pullback or consolidation.
- Entry/Exit Points: Look for opportunities to enter on pullbacks and consider taking profits if the stock reaches overextended levels.
In conclusion, the technical analysis suggests a bullish outlook for SUPP stock in the next few days, but it is essential to remain vigilant and adapt to changing market conditions.