Technical Analysis of SURE 2024-05-10
Overview:
In analyzing the provided technical indicators for the last 5 days, we will delve into the trend, momentum, volatility, and volume indicators to forecast the possible stock price movement for the next few days. By examining these key aspects, we aim to provide a comprehensive and insightful prediction backed by data-driven analysis.
Trend Indicators:
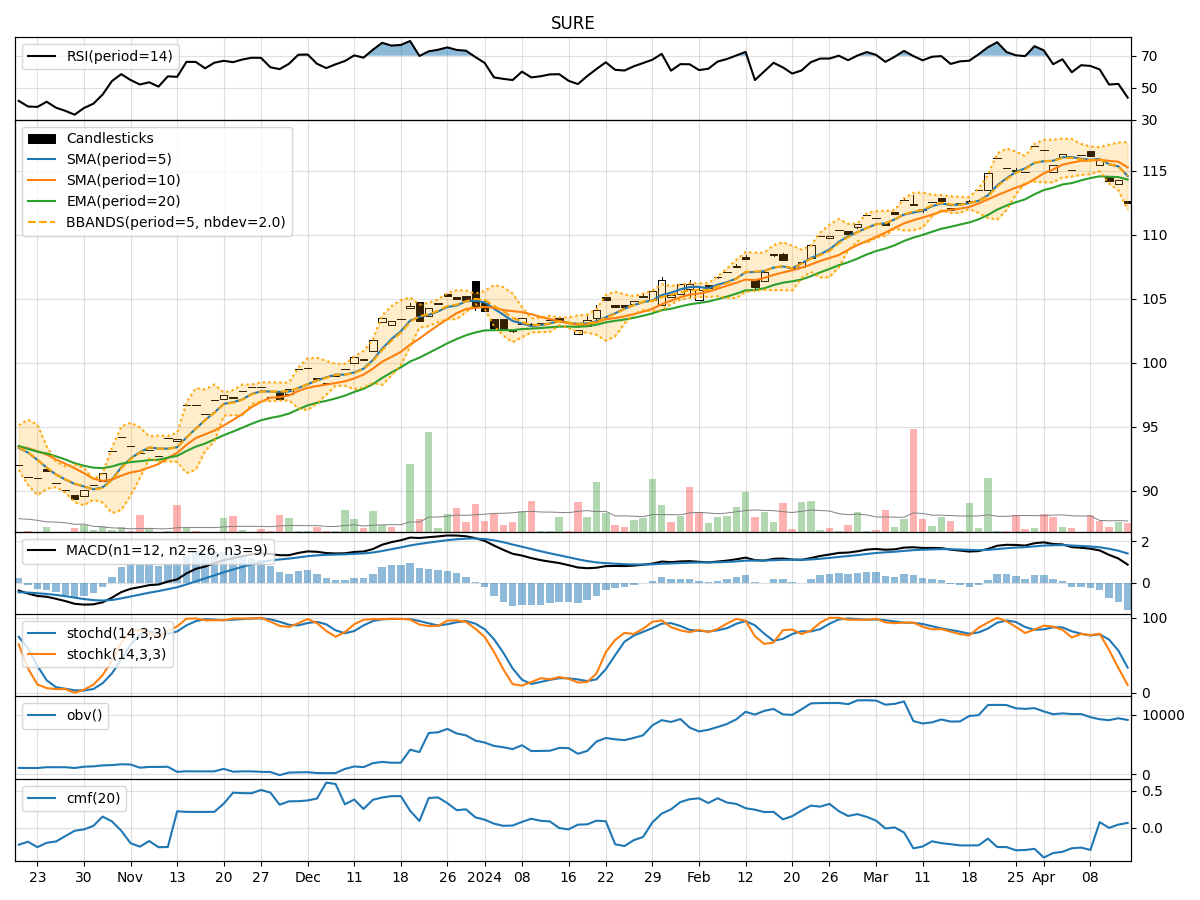
- Moving Averages (MA): The 5-day moving average has been consistently rising, indicating a bullish trend in the short term.
- MACD (Moving Average Convergence Divergence): The MACD line has been above the signal line, suggesting a bullish momentum.
- RSI (Relative Strength Index): The RSI has been fluctuating around the neutral zone, indicating a balanced market sentiment.
Momentum Indicators:
- Stochastic Oscillator: The stochastic oscillator is in the overbought zone, suggesting a potential reversal or consolidation.
- Williams %R (Willams Percentage Range): The Williams %R is hovering around the oversold territory, indicating a possible buying opportunity.
Volatility Indicators:
- Bollinger Bands: The stock price has been trading within the Bollinger Bands, indicating normal volatility levels.
- BB% (Bollinger Bands Percentage): The BB% is relatively stable, suggesting a lack of extreme price movements.
Volume Indicators:
- On-Balance Volume (OBV): The OBV has been fluctuating, indicating mixed buying and selling pressure.
- Chaikin Money Flow (CMF): The CMF is positive, suggesting a net inflow of money into the stock.
Key Observations:
- The trend indicators point towards a bullish sentiment in the short term.
- Momentum indicators show conflicting signals, with stochastic oscillator indicating overbought conditions and Williams %R suggesting oversold levels.
- Volatility remains stable within the Bollinger Bands, indicating a lack of significant price fluctuations.
- Volume indicators reflect mixed market participation, with OBV fluctuating and CMF showing positive money flow.
Conclusion:
Based on the analysis of the technical indicators, the next few days' possible stock price movement is likely to be sideways with a slight bullish bias. The bullish trend indicated by moving averages and MACD may support a modest price increase, while the conflicting signals from momentum indicators suggest a potential consolidation phase. The stable volatility and mixed volume indicators further support the expectation of a sideways movement with limited fluctuations. Traders should closely monitor key levels and wait for clearer signals before making significant trading decisions.