Technical Analysis of SUSB 2024-05-10
Overview:
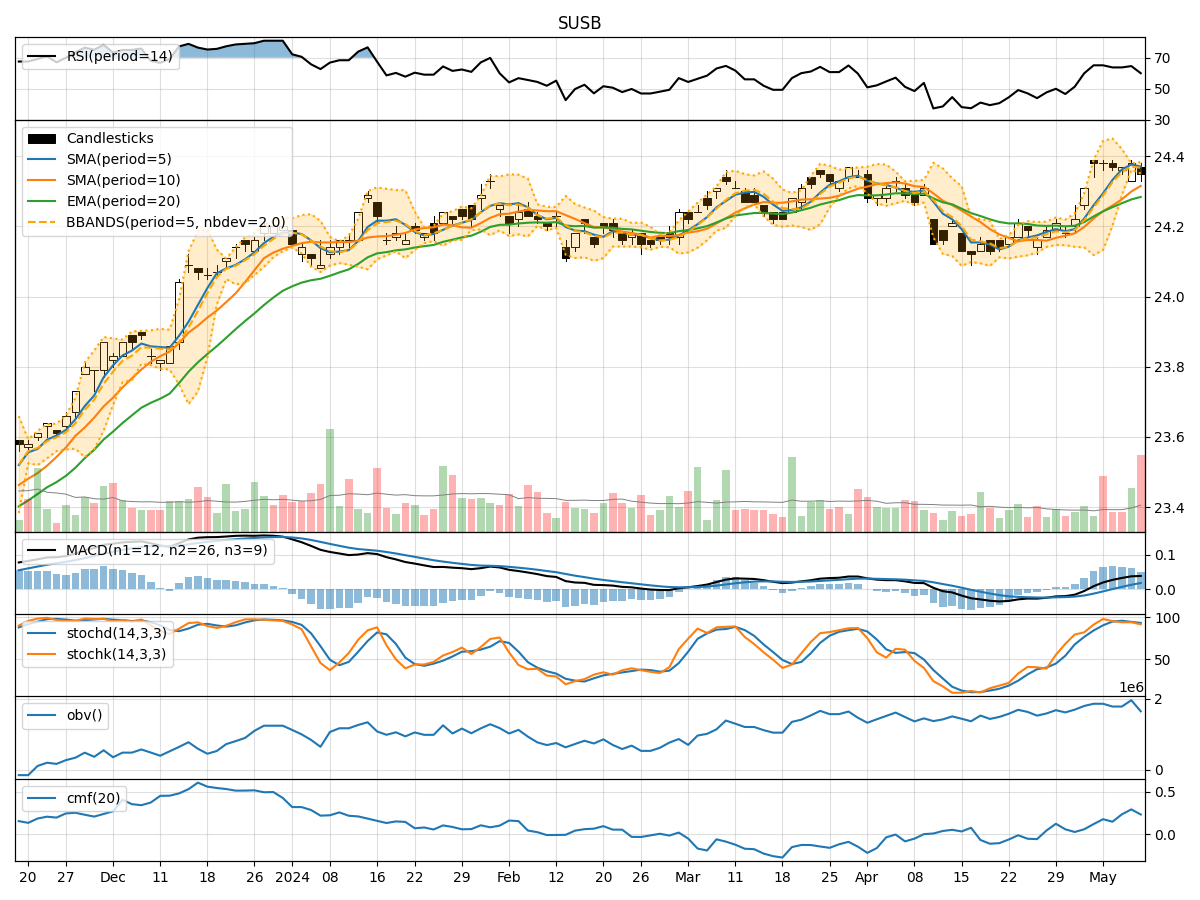
In the last 5 trading days, SUSB stock has shown relatively stable price movements with minor fluctuations. The technical indicators suggest a neutral to slightly bullish sentiment in the market. Let's delve deeper into the analysis of trend, momentum, volatility, and volume indicators to provide a comprehensive outlook on the possible stock price movement in the next few days.
Trend Indicators:
- Moving Averages (MA): The 5-day MA has been consistently above the closing prices, indicating a short-term bullish trend.
- MACD: The MACD line has been trending upwards, and the MACD histogram has been mostly positive, suggesting a strengthening bullish momentum.
Momentum Indicators:
- RSI: The RSI has been fluctuating around the neutral level of 50, indicating a balanced momentum between buying and selling pressure.
- Stochastic Oscillator: Both %K and %D have been in the overbought zone, suggesting a potential reversal or consolidation phase.
Volatility Indicators:
- Bollinger Bands (BB): The stock price has mostly stayed within the bands, indicating a stable price range with no extreme volatility.
Volume Indicators:
- On-Balance Volume (OBV): The OBV has shown mixed signals, reflecting indecision among investors regarding the stock.
- Chaikin Money Flow (CMF): The CMF has been positive, indicating that money is flowing into the stock, albeit at a moderate pace.
Key Observations and Opinions:
- Trend: The trend indicators suggest a slightly bullish bias in the short term.
- Momentum: Momentum indicators show a lack of strong directional momentum, signaling a potential period of consolidation.
- Volatility: Volatility remains relatively low, indicating a stable price environment.
- Volume: Mixed volume signals imply uncertainty among market participants.
Conclusion:
Based on the analysis of technical indicators, the stock is likely to experience sideways movement or consolidation in the next few days. The lack of strong momentum and mixed signals from volume indicators suggest a period of indecision among traders. Investors should closely monitor key support and resistance levels for potential breakout opportunities. Exercise caution and wait for clearer signals before making significant trading decisions.