Technical Analysis of SUSC 2024-05-10
Overview:
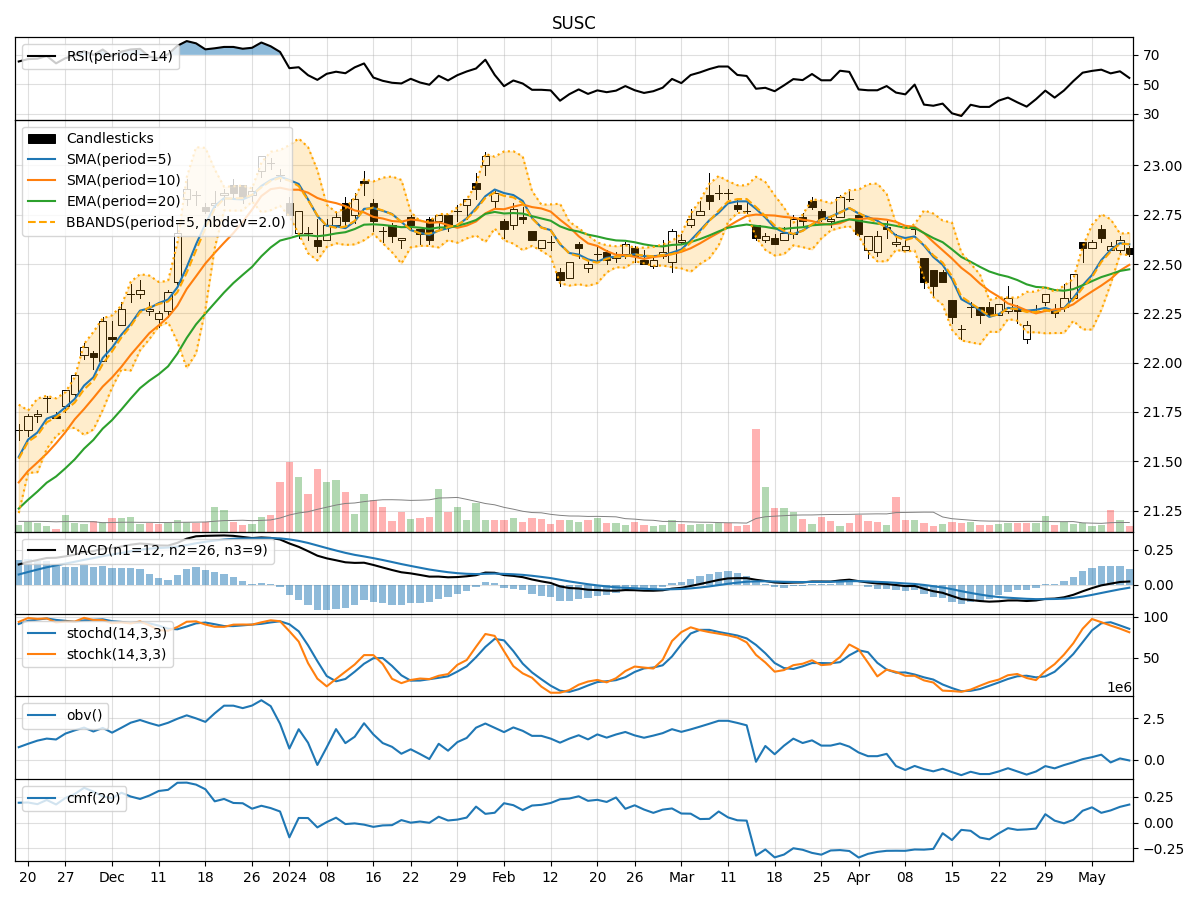
In analyzing the technical indicators for SUSC over the last 5 days, we will delve into the trend, momentum, volatility, and volume indicators to provide a comprehensive outlook on the possible stock price movement. By examining these key factors, we aim to offer valuable insights and predictions for the upcoming days.
Trend Analysis:
- Moving Averages (MA): The 5-day Moving Average (MA) has been showing an upward trend, indicating a positive momentum in the stock price.
- MACD: The Moving Average Convergence Divergence (MACD) has been consistently positive, suggesting a bullish trend in the stock.
- RSI: The Relative Strength Index (RSI) has been fluctuating around the neutral zone, indicating a balanced buying and selling pressure.
Key Observation: The trend indicators suggest a bullish sentiment in the stock price movement.
Momentum Analysis:
- Stochastic Oscillator: Both %K and %D values have been decreasing, indicating a potential reversal in momentum.
- Williams %R: The Williams %R is in the oversold territory, suggesting a possible buying opportunity.
Key Observation: Momentum indicators are signaling a short-term bearish momentum.
Volatility Analysis:
- Bollinger Bands (BB): The Bollinger Bands have been narrowing, indicating decreasing volatility in the stock price.
- BB% (Bollinger Band %B): The %B value is close to 0, suggesting a potential consolidation phase.
Key Observation: Volatility indicators point towards a period of consolidation or sideways movement.
Volume Analysis:
- On-Balance Volume (OBV): The OBV has been fluctuating, indicating mixed buying and selling pressure.
- Chaikin Money Flow (CMF): The CMF is positive, suggesting a net inflow of money into the stock.
Key Observation: Volume indicators show a neutral stance with no clear direction.
Conclusion:
Based on the analysis of the technical indicators, the next few days' possible stock price movement for SUSC is likely to experience sideways consolidation with a short-term bearish momentum. Traders should exercise caution and closely monitor key support and resistance levels for potential entry or exit points. It is advisable to wait for a clearer trend confirmation before making significant trading decisions.
Disclaimer:
Remember that technical analysis is not a guaranteed predictor of future price movements, and other fundamental factors can influence stock prices. It is essential to conduct thorough research and consider multiple indicators before making any investment decisions. Consulting with a financial advisor is recommended for personalized investment advice.